
Core Materials, Permeability and Their Losses
Primarily inductors consist of a coil. If we insert a core of magnetic material the inductive properties of the coil will increase. Such coils are then called chokes. This article explains the basic core materials, their losses and material permeability.
The article is split into three chapters:
- brief introduction into Core Types
- Core Materials and their Losses
- Permeability
Core Types
When we draw current through a choke electric currents are induced in the magnetic material that try to create a counteracting magnetic field. These currents are undesired both for that reason and because they create heat losses.

Homogeneous magnetic bodies are excluded; the induced current would be too high. Instead mutually isolated ribbons are used or a powder technology where the binder material between the magnetic granules limits the induced current by their resistivity.
Soft Iron Cores
The magnetic flux can be increased by means of a core of laminated soft iron or iron powder mixed with a binder. As stated in the introduction the distribution in electrically isolated disks or surface oxidized powder granules reduces the eddy current losses in the choke. The saturation induction
according to Figure 1., is relatively high in chokes with iron materials in the core, up to 2.3 T. They can operate at high frequencies; metal alloys to 100 kHz and iron powders to more than 100 MHz. The temperature stability is good. The temperature range for iron powder cores is -55/+105 °C.
Amorphous Magnetic Materials
These non-crystalline magnetic materials consist of ferro or cobalt based powdered amorphous alloys that are baked into some shape impervious material. The core material with the magnetic powder granules constitutes a core with “distributed air gaps” that limits eddy currents. Another manufacturer heats up the magnetic foils/bands and precipitates the cooling process so rapidly that the metal becomes amorphous. The eddy current limitation is achieved by using these thin ribbons mutually isolated, in the cores. The ribbons are approximately 20 mm (0.8 mils) thick.
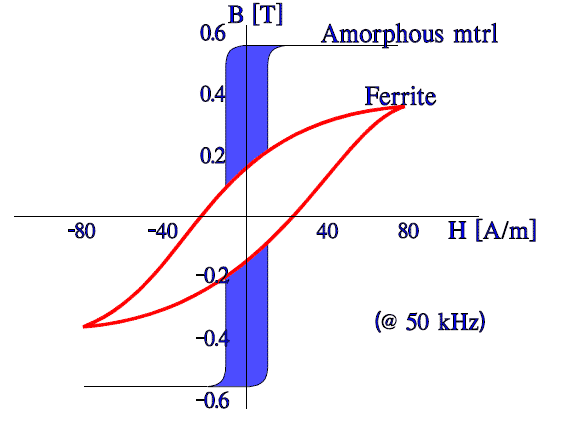
Amorphous core materials produce a narrow and high, nearly rectangular BH characteristic that has its highest inductance when the current passes through zero and a nearly negligible inductance as soon as the current reaches a certain strength. Thus the hysteresis losses will be small. The saturation flux is high (Figure 2.). For some laminated cores it is more than 1.5 T. The Curie temperature may, depending on material, vary between 200 and 400 °C. The initial permeability is in some materials very high, up to 100 000.
Ferrite Core Materials
The most common inductor material is still the ferrites. They are ferro magnetic and are ceramic materials. They consist of a mixed mass of pulverized oxides of iron and other alloys that is pressed to the desired shape and then sintered. The material resistivity is much higher than that of
iron and the eddy current losses correspondingly low, which makes them suitable for high frequency applications.
They have a wide range of permeabilities from 10 to 20 000 but a fairly low saturation induction, < 0.5T. The temperature range is –55/+105 °C. The following figure shows a comparison of characteristics of metals, amorphous materials and ferrites.
Core Shapes
There are a number of different manufactured styles and shapes. Some of the most common are shown in following figure 3. The different manufactured shapes are not shown to the same scale. Rods, E cores, toroids and pot cores are provided with a winding, either direct on the core or via a bobbin. Attenuation ferrites surround the current path.
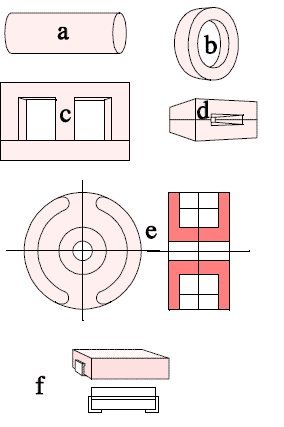
· a) cylindrical rod core
· b) toroid or “attenuation bead”
· c) E core with yoke
· d) attenuation ferrite for flat conductor cable
· e) pot core
· f) SMD ferrite.
Core Materials and Their Losses
In deeper theoretical background introducing solid material into a magnetic field, its behaviour can be classified in three groups:
- diamagnetic materials
- paramagnetic materials
- ferromagnetic materials
Diamagnetic and paramagnetic materials have a relative permeability close to one. They are therefore only of limited suitability in the construction of inductive components. Ferromagnetic materials have a relative permeability between 10 and 100 000. In order to understand ferromagnetic core materials, the internal structure of these materials must be examined closer.
The atoms in ferromagnetic materials (termed magnetic materials as follows) have a magnetic moment. In the unmagnetized state, the magnetic moments of the atoms are aligned in all spatial directions, whereby atoms show a preferred direction within limited cells (Weiss domains). The boundaries between these Weiss domains are termed as Bloch walls.
If an external magnetic field is now applied, this attempts to orientate the magnetic moments along the magnetic field direction, whereby the crystal direction remains the preferred direction. This occurs because the Weiss domains with a magnetic moment in the direction of the field grow at the expense of neighboring domains. This is described as shifting of the Bloch walls. This is a reversible process within certain limits.
If the field strength is increased, the Bloch walls jump from one defect site to the next. This is then no longer reversible. If all domains are aligned, a further increase in the magnetic field rotates the magnetic moments from their crystal direction. Here one speaks of rotating processes.
This behaviour is reflected in the hysteresis curve (also known as the B-H curve) as shown in Figure 1. Reversible Bloch wall shifts predominate in the lower region of the new curve. In the middle region, where the magnetic flux density B rises almost linearly with the field strength H, the irreversible jumps of the Bloch domains (so-called Barkhausen jumps) may be identified. In the saturation range where the rise in the magnetic flux density is very much slower, the rotating processes predominate. Further growth of the Weiss domains is no longer possible.
Reducing the field strength further, many of the shifted Bloch walls remain stuck at defect sites. The magnetic flux density falls along another curve. Magnetic flux is still present even when the field strength has returned to zero. This refers to remanent flux density Br. In order to reset the flux density to zero, a certain negative field strength has to be applied, the so-called coercive field strength HC. The hysteresis curve profile is dependent on the material.
According to the value of the coercive field strength, “soft magnetic” and “hard magnetic” materials are distinguished.
- soft magnetic materials: HC < 1000 A/m are mainly used in inductive components
- hard magnetic materials HC > 10000 A/m are mainly used as permanent magnets and with electromagnets
The area within the hysteresis curve corresponds to the core losses per cycle. At higher frequencies there are also eddy current losses.
A frequently asked question concerns core material losses and the resulting power dissipation through ripple current in the storage choke. We will provide some basic information in this section.
Expensive measuring techniques are required to determine core losses. These are generally based on the measurement of parameters defined for toroidal ferrites and in order to obtain relatively accurate results, phase-accurate power amplifiers and multiplying measuring instruments are required for power measurement with a low phase difference. The classical specification of core losses is given by the “Steinmetz formula” named after its inventor:
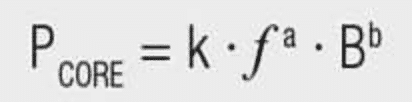
B = peak value of induction
Pcore is the average power dissipation per volume unit
f is the frequency of the sinusoidal measurement voltage. For ferrites the coefficient “a” is between 1.1~1.9 and the coefficient “b” is in the range 1.6 ~ 3. An iterative approach is required for other materials in order to identify the coefficients.
However, in switching controller applications we find rectangular voltages across the storage choke. For a 50% duty cycle, the accuracy of the Steinmetz formula is already reduced, for small or large duty cycles errors of 100% can arise ! See Figure 4.


The accuracy of the Steinmetz formula is further compromised by:
- ignoring the DC premagnetization (→ a different B-H curve is produced!)
- ignoring the current harmonics
- ignoring the Vμsec product (higher Vμsec product ~ higher losses)
- temperature dependence of the core material (many core materials only attain their loss minimum at elevated temperatures!)
For these reasons, all calculations with the classical Steinmetz formula must always be evaluated in the light of these facts. The safest method of assessing whether the design of a storage choke works optimally is efficiency measurement on the switching controller and the measurement of self-heating in operation (taking into account the heat coupling with hotter components such as diodes and switching transistors!).
Example: Material 1P2400
MnZn-ferrites are mainly used for transformers working in the range between 50 and 500 kHz. The material 1P2400 used in example, is characterized as follows in Table 1. that provides an overview of the most important parameters of the material. The permeability μ is around 2400.
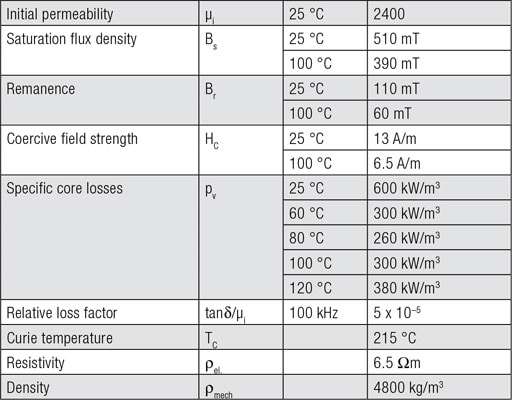
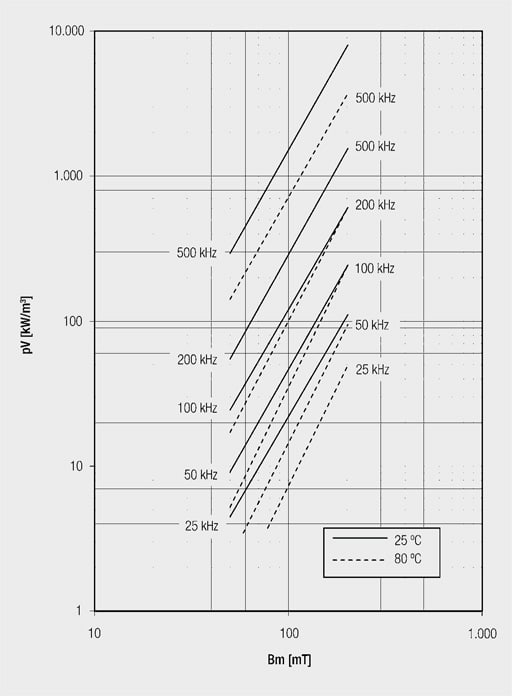
Figure 6. shows the specific core losses as a function of magnetic flux density at different frequencies for a sinusoidal input and temperatures of +23 °C and +80 °C. The core losses at +80 °C are lower than at +23 °C. As transformers usually work in the range between +60 °C and +100 °C due to self-heating, one can assume the +80 °C curves when calculating losses. The so-called Steinmetz coefficients may be obtained from the curves and by entering into the Steinmetz formula the losses at other frequencies and flux densities may be interpolated.
As the magnetic behaviour of ferrites is not linear, the respective Steinmetz coefficients only apply within certain ranges. Also, switching transformers are usually not driven sinusoidally. So the calculated core loss values may deviate in reality.
Permeability μ

Permeability describes an important effect in ferromagnetic materials. If a ferromagnetic material is placed in a magnetic field, it is observed that the magnetic flux becomes concentrated in this material. Analogous to electric resistance, the ferromagnetic material presents a good conductor for the field lines. Permeability may therefore be described as a magnetic conducting or penetrating property.
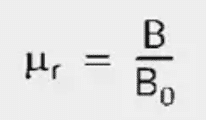
The factor by which the induction (B) changes through the introduction of the material is called the relative permeability (μr).
The equation for relative permeability is extended for the space filled by the material:
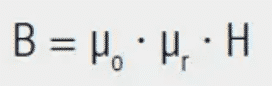
The induction in the core material (B) is given by:
The relative permeability of the material is however not constant but strongly non-linear. The permeability of a material is essentially dependent on:
- The magnetic field strength H (dependent on operating conditions → hysteresis curve)
- The frequency f (frequency dependent complex permeability)
- The temperature T (→ temperature drift, → Curie temperature)
- The material used
Typical permeabilities (μr):
- Iron powder cores, superflux cores: 50 … 150
- Manganese-zinc cores: 300 … 20000
- Nickel-zinc cores: 40 … 1500
Complex Permeability
The introduction of complex permeability allows separation into an ideal (zero loss) inductive component and a frequency dependent resistive component which represents the losses of the core material. This treatment can be applied to all core materials and clearly differentiates between inductors and EMC ferrites.
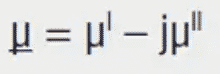

The inductive component is represented by (μI) and the resistive component by (μII). The following applies to transformation on the impedance level:
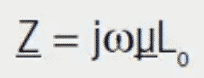
with L0 = inductance of an air coil of the same construction and field distribution, without core material (μr = 1).
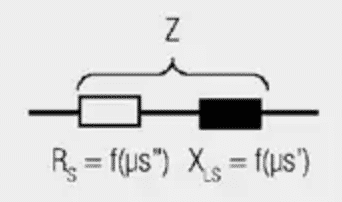
For the series impedance (Z):
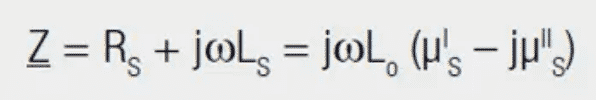
Multiplying out and dividing into real and imaginary parts provides the following relationship:
- Loss component RS = ωL0μSII
- Inductance component XLS = ωL0μSI
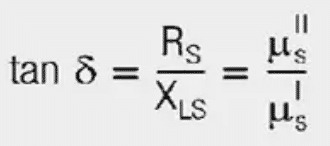
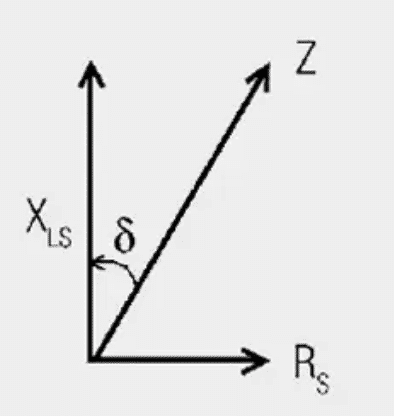
For the loss angle (δ), tan δ is given by:
A large angle (δ) means a high core loss; the phase relationship between voltage and current at the inductor is less than 90°.
Furthermore:
μSI = μi
μSII = μi · tan δ
(μi = initial permeability)
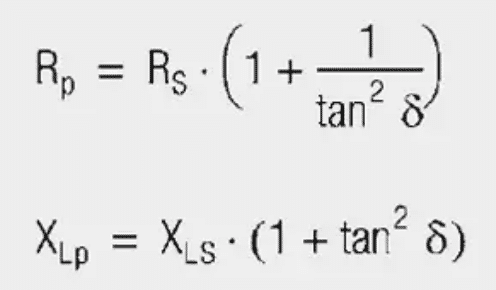
Similarly, inductance and resistance can also be presented as a parallel equivalent circuit; the following relationships [8] apply. These frequency dependent components can be measured with the aid of impedance analysis and represented in an associated graph example on Figure 10.
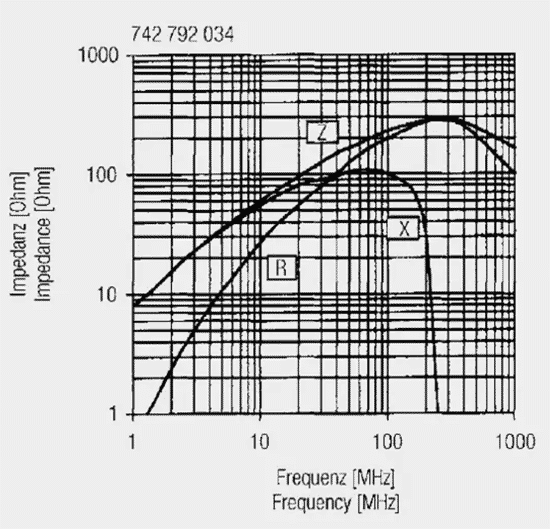
Observations from the above measurement graph:
- The inductance is stable in a certain frequency range, to show strong frequency dependence above approx. 10 MHz. Above 100 MHz the inductance falls sharply, down to zero at approx. 250 MHz.
- The loss component (R) grows continuously with frequency and reaches the same value as the X component at the so-called ferromagnetic resonance frequency. The resistance value rises until the high MHz range and dominates over the impedance (Z).
The component shown here – a SMD ferrite – serves the user as a broadband absorber or filter component, as a result of its broadband loss resistance (R).
Core Materials Comparison
Core materials are only used effectively in the construction of inductors within a limited frequency range, as a result of the frequency dependent loss components. Core losses rise sharply above a typical frequency limit. The core material may then be used then as a filter component. See Impedance vs frequency chart on Figure 11.
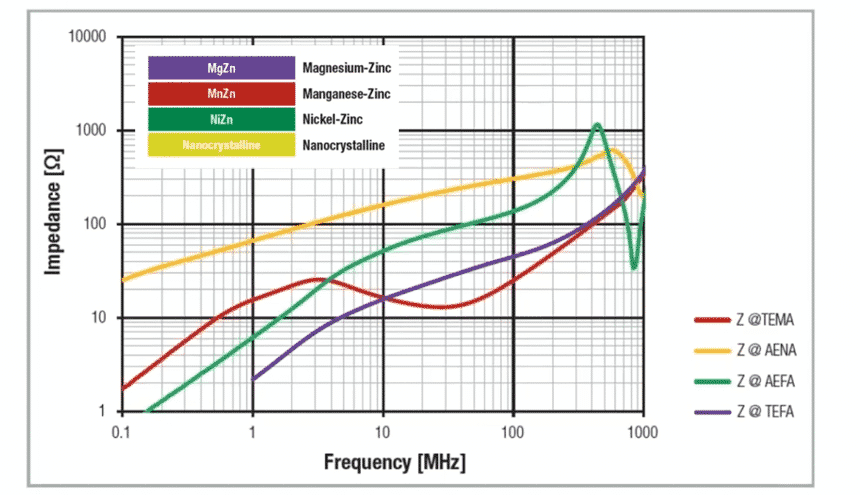
This relationship and also the limits of core materials are illustrated in the following graph on Figure 12. and 13.:


Observations:
- Iron powder materials (Fe): May be used as pure inductance up to approx. 400 kHz; the R loss component dominates thereafter up to approx. 10 MHz (also beyond depending on the core material). The core is no longer effective in the frequency range above approx. 20 MHz.
- Manganese-zinc cores are inductive up to frequencies around 20 MHz – 30 MHz, typically with losses rising above 10 MHz. The core material is no longer effective in the frequency range above –approx. 80 MHz.
- Nickel-zinc cores are inductive up to frequencies around 60 MHz, above this, the core material shows losses up to frequencies of 1 GHz and more.
This quantitative comparison illustrates why nickel-zinc ferrites have become predominant in the EMC field. The core material can perform an effective filter function in the frequency range of greatest interest.