Pulse, Load Power and Voltage Derating
R1.7 PULSE LOADS
In many applications the resistor will be subjected to pulse loads. We make distinctions between periodical/repetitive loads and pulse trains; on one hand, where the pulse is repeated at a certain frequency, and on the other separate pulses where a possible repetition will occur after so long time that the resistor has recovered its original ambient temperature.
What happens if permanent load is applied to the resistor:
- Resistive layer / film: transfer of the electrical energy into Joule heat
- Resistor (ceramic) body: heat conduction impacted by its heat capacity
R1.7.1 Periodic pulse loads
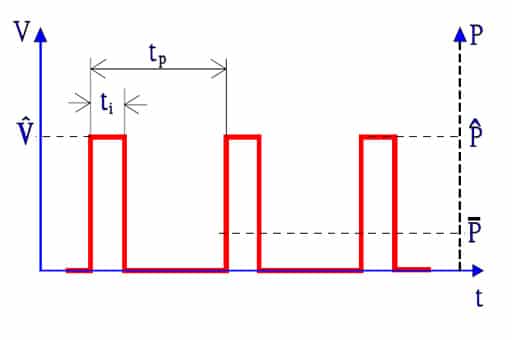
Figures R1-7 and R1-8 show two typical types of pulses, rectangular ones and exponential ones. The theoretical square pulse has in practice sloping fronts and rear edges. The definitions of times and voltages of a square pulse are shown in Figure R1-9. With definitions from Figure R1-7, R1-8 and R1-9, the following general conditions apply.
PT = permissible power at the ambient temperature T
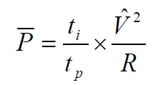
P ¯= mean power in the pulse train.
1/tp = pulse repetition frequency.
ti = pulse width t2 – t1.
R = rated resistance.
V = instantaneous voltage.
tr = rise time (Fig R1-9)

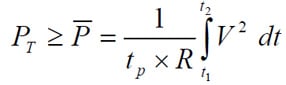
For rectangular pulses the following equation applies:
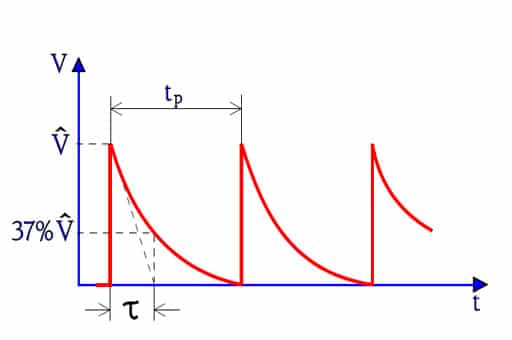
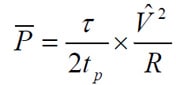
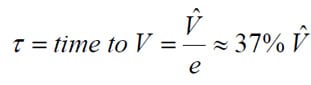
and for exponential pulses, according to Figure R1-8;
One talks in this connection about
1. Power overload factor

2. Voltage overload factor

3. Current overload factor

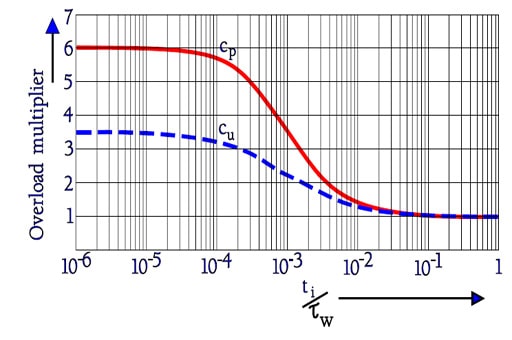
Figure R1-10 shows the overload factors cp and cu for carbon film resistors.
Pulse loads in single pulses or pulse trains, with a permissible mean power as shown in Equation R1-6 or R1-7, always have to take into consideration the voltage strength.
A possible pulse load of 100 PR for 10 ms does not give us permission to directly apply 1000 PR for 1 ms. The latter pulse implies √10 times higher voltage since V=√( P x R). At a certain resistance value it may lead to internal spark-overs. In recommendations for pulse powers the quotient Pˆ/PR stops growing on in principle the same way as cp in Figure R1-10 does, when the pulse length decreases. Note also that a voltage quotient is chosen for the power overload factor, cp, which means that the power quotient Pˆ/PR can be obtained as (cp)2.
The overload factors in Equations R1-8, R1-9 and R1-10 are confined by the resistor material and construction. For example, wirewound resistors have much higher resistance against overloads than film resistors which in turn may differ a good deal reciprocally. For example, carbon film has a considerably higher pulse capability than metal film which, among other things, depends on the film thickness. A carbon film is thicker than a metal film of corresponding resistance and thus contains more heat absorbing substance. Hence the current density will be too high in the metal film, if it is loaded with a maximum pulse for carbon film. Equation R1-10.
In thick film/metal glaze resistors other conditions apply. The conductive paths of the film constitute a series-parallel network of an infinite number of tracks consisting of conductive particles reciprocally connected in weak contact points. The pulse load capability is generally poorer for these resistors than that of metal films. It may be otherwise for low resistance values where the metal content is higher.
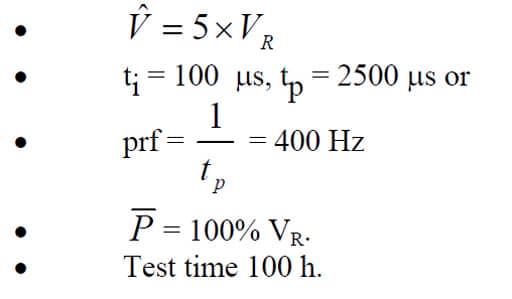
In order to verify the pulse capability certain standard tests are outlined by the IEC 60115, for example, the following suggested data:
R1.7.2 Single pulses
Sometimes it is necessary to load the resistor with a single pulse (that possibly may be repeated after so long time that a possible heating can be neglected). Certain standardized tests for film resistors as outlined in appendices to IEC 60115 give us some useful basics for comparison. Two pulse shapes are defined: 1.2/50 and 10/700. The figures mean rise time tr/pulse time ti according to definition in Figure R1-9 and are expressed in microseconds.
The test is performed with a successively increased voltage expressed in multipliers of the limiting voltage Vg until the resistance changes exceed specified values, usually the maximum change during a 1000 hrs life test. (The limiting voltage Vg corresponds to the maximum field strength that the resistor construction can withstand. See figure and legend under R1-8). The test follows the description in Table R1-2.
Table R1-2. Summary and excerpts of pulse tests in the standard IEC 60115.
| Pulse shape tr/ti (μs) | Multiples of Vg | Least pulse distance (s) | Number of pulses |
| 1.2/50 | 10 | 12 | 5 |
| 1.2/50 | 15 | 12 | 5 |
| 1.2/50 | 20 | 12 | 5 |
| 10/700 | 2…6 | 60 | 10 |
The following comparative figure for single power pulses may serve as a guidance for comparison of standard designs in different materials, provided the resistance value doesn’t cause the voltage in the overload factor to exceed cu (Equation R1-8). We choose as a reference power pulses with the duration 10 ms. Comparison between materials gives
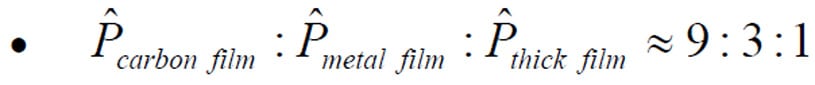
Note, however, that in the lower resistance range thick films may be more resistive to pulses than corresponding metal films.
If we compare the effect from power pulses of different magnitude applied on a certain design we get

We repeat that the stated ratios are approximate. What recommended pulse power, Pˆ, the resistor design can stand has to be read from the manufacturer’s technical information and diagrams and “possible” pulse power has to be verified by tests on chosen resistor type and manufacture.
R1.8 POWER and VOLTAGE DERATING
Vg = limiting voltage. PR = rated power
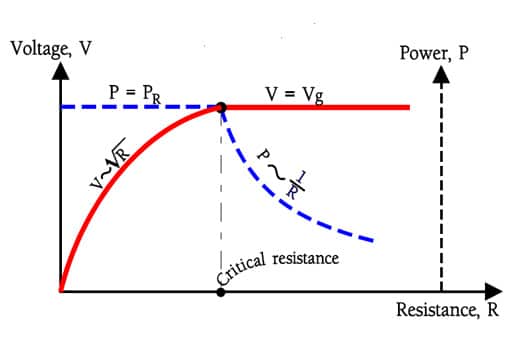
In Figure R1-11 we have plotted the voltage V and the power, P, versus resistance. In the left half of the diagram the power is constant and equal to PR (dotted line). Because P = V2/R we get V ∼√R . With a linear scale on the resistance we get the bent unbroken voltage curve right on to the point where the construction doesn’t stand any higher field strength. We run the risk of having a flash-over internally or to earth, which may happen above the so called limiting voltage, Vg. The corresponding resistance value is called critical resistance. The limiting voltages are standardized in the IEC and CECC systems.
In the right half of the diagram the voltage is constant, i.e., V = Vg. The power curve varies in accordance with the proportionality P ~ 1/R.
A resistor that works at rated power at an increasing ambient temperature eventually will become so warm that the materials can’t stand the temperature. If we still want to use the component at a higher ambient temperature we can lower the self-heating, i.e., the load, as shown in Figure R1-12. This kind of reduced load is also called derating. Thus, eventually, we attain the point on the temperature scale where the materials once more, in spite of zero power, tell us we have reached the temperature limit.
The different temperatures and powers that are defined in Figure R1-12 are obtained from the IEC standards. The shape of the curve, however, is commonly accepted in all standard systems. Sometimes we can find variants with broken curves but the basic principle is the same. Where on the temperature scale the standardized break point is varies. Most common is 70°C. The upper category temperature, Tuc, depends on the resistor type and is specified according to standard temperatures.

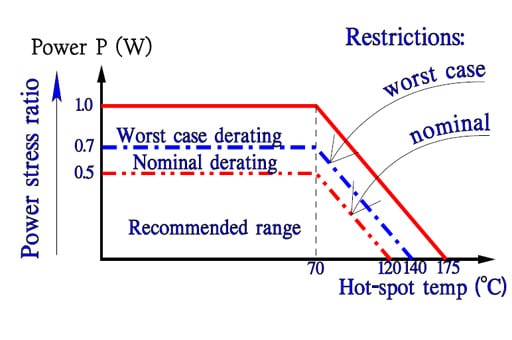
Maybe the alert reader wonders if we can’t load the resistor harder below the rated temperature TR. Well, there are even older specifications that state such possibilities. Now, however, for reliability reasons we go in the opposite direction. The rated power is reduced, i.e., derated. Then we get diagrams that in principle look like the one in Figure R1-13. There a typical case of derating is described according to a US military standard.