
Potentiometers & Rheostats Basic Function
R 4 POTENTIOMETERS & RHEOSTATS
R 4.1 CONCEPTS AND DEFINITIONS
R 4.1.1 Basic concepts
A potentiometer (short name “pot”/”pots”) may in its most simple form be drawn schematically as in Figure R4-1.
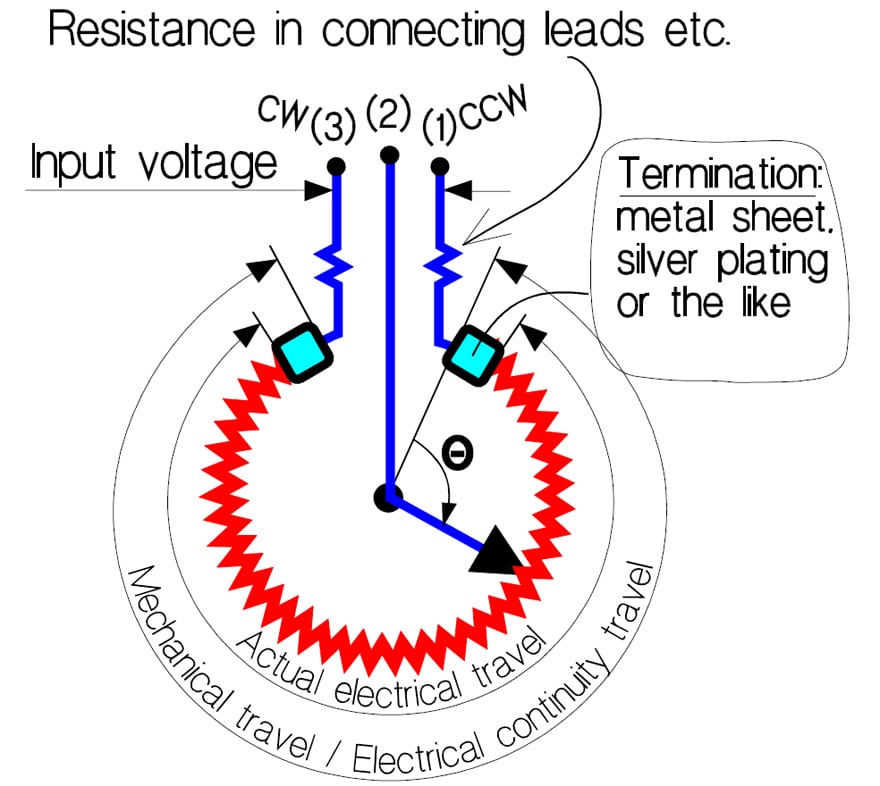
Between the two fixed terminals there is a third one connected to a sliding contact or Wiper. Because the direction of motion of the sliding contact is hidden in encapsulated types the fixed terminals usually are marked with
- CW, i.e., clockwise, and
- CCW, that stands for counterclockwise.
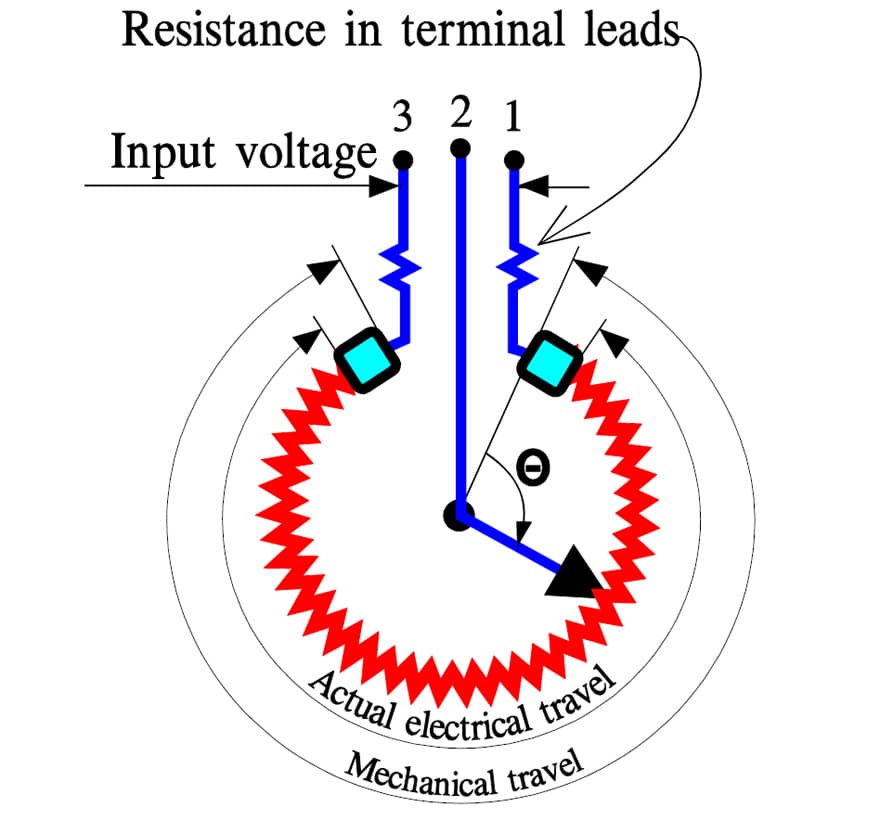
With the slider positioned in either of the two end points we measure between the fixed terminals the Rated resistance, Rtot, of the potentiometer. In Figure R4-1 we also have indicated the rest or End resistance, ER, that in wirewound potentiometers is measured between terminals (2) and (1) or (2) and (3) when the wiper is positioned in the corresponding end point where integral stops prevent further movement. In non-wirewounds the shaft shall be positioned at either of the theoretical end points, i.e., at the ends of the theoretical electrical travel (Figure R4-4). Sometimes the end resistance, ER, is expressed in % of Rtot. Precision wirewound potentiometers have terminations like the one in Figure R4-2.
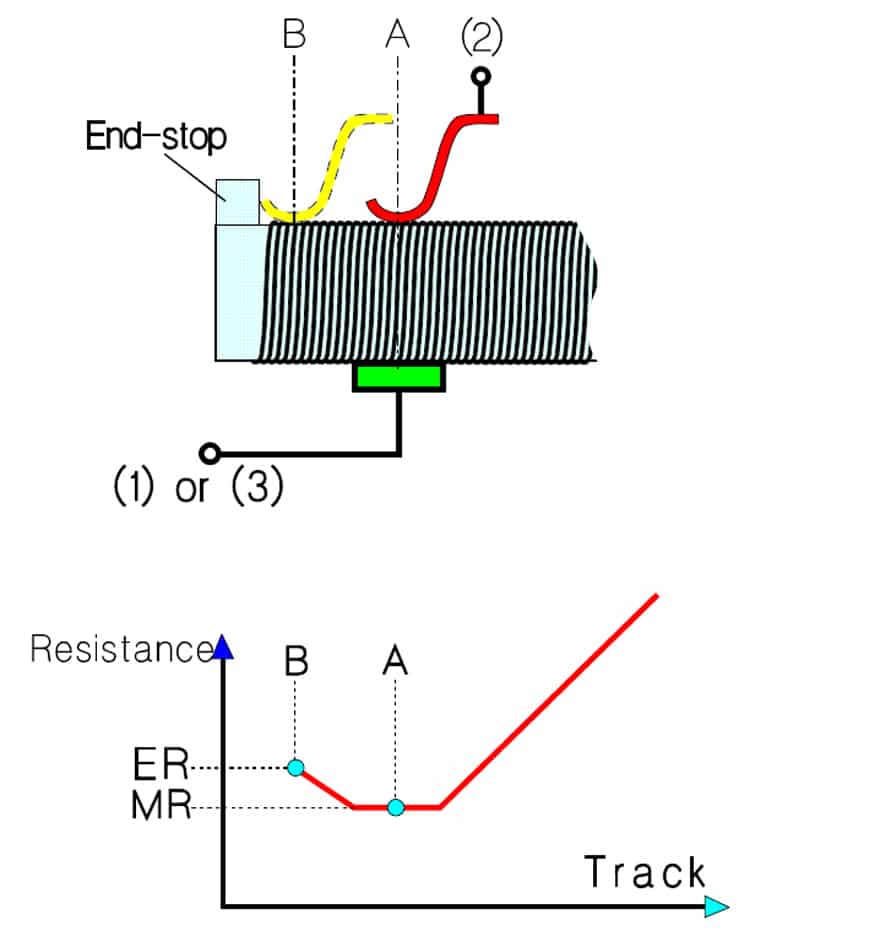
If we measure the rest resistance we also get an extra contribution from the futile part of the resistance track (position B in the figure). If we move the wiper to position A the resistance will drop to a minimum, the so called Minimum resistance, MR. Instead of ER, for non-wirewound precision potentiometers the End voltage, EV, is specified.
According to industry standard of the Variable Resistive Components Institute (VRCI) measurement shall be done between the wiper and an end point. The shaft then is positioned at the theoretical end point (non-wirewound) or at the end point (wirewound). The theoretical end point is represented by position B1 in Figure R4-3, the end points of a wirewound potentiometer are represented by start of actual electrical travel in Figure R4-1. The end voltage is expressed in percent of the input voltage E.
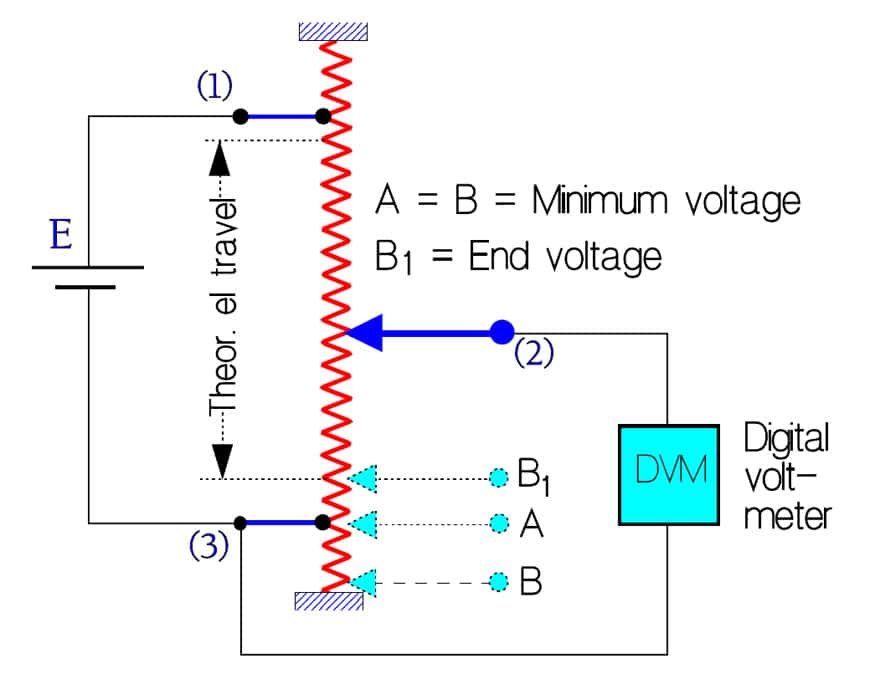
If we, as proposed, should measure in position B the result would be the same as in position A. The current through the DVM is assumed to be negligible.
The Minimum voltage MV is the smallest or lowest voltage between the wiper terminal and an end terminal when the shaft is positioned near the corresponding end of electrical continuity travel (Position A in Figure R4-3).
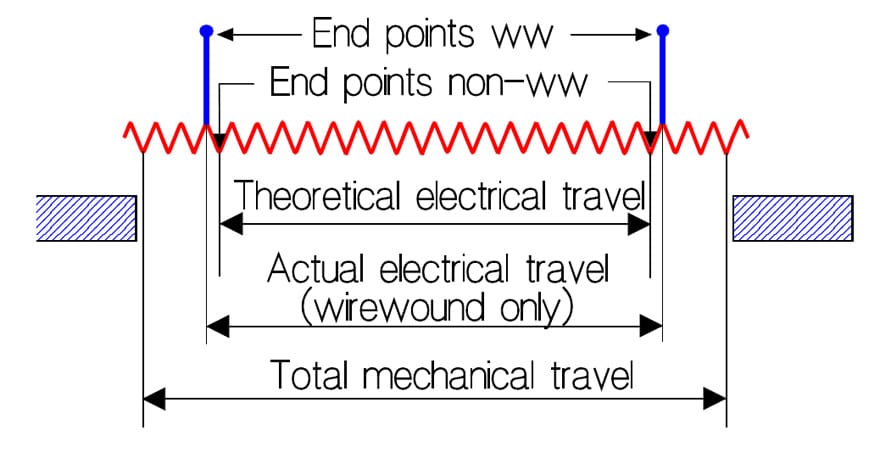
Actual electrical travel applies to wirewound potentiometers only and concerns the total travel between end points as shown in Figure R4-4.
In that point of the shaft travel where we start observing the first significant changes of the output voltage Type 2 potentiometers and trimmers sometimes have a definition of the Effective minimum resistance. Compared to the End Resistance, ER, it is approximately 10 times higher, for example 2% when the ER is specified to 0.2%.
The Total mechanical travel is determined by the total travel of the shaft between integral stops. If there are no stops (as in non-wirewound servo potentiometers) the mechanical travel is continuous and thus the mechanical travel 360°.
That part of the travel where we have a continuous electrical connection between wiper and terminals is called Electrical continuity travel. In wirewound potentiometers it coincides with the total mechanical travel.
At a specified shaft position the corresponding output ratio is defined as the Index point, IP. Usually IP is positioned at approximately 50% of the maximum output ratio. It is used to establish a shaft position reference, for example when specifying the Theoretical electrical travel that usually is centered between the end points of the actual electrical travel, Figure R4-4. Suppose now that the IP is defined at a shaft travel of 170°. The theoretical electrical travel then will range between 0 and 340°.
The Insulation resistance, IR, is measured with DC between the connected terminals and all other electrically conductive parts like shaft, metal housing, mounting details etc. IR should be at least 1000 MΩ.
Cycle. In potentiometer contexts we meet the expression cycle which means a shaft travel from one end point to the other and back to the starting point.
Rotational life. The specified maximum number of shaft revolutions that a potentiometer shall be able to stand with preserved resistance stability is called rotational life.
R 4.1.2 Potentiometer or Rheostat
In principle a variable resistor may be used in two different ways with respect to the load: As a parallel resistor, i.e., as voltage divider or potentiometer, and as series resistor or rheostat, i.e., a type of current regulator.
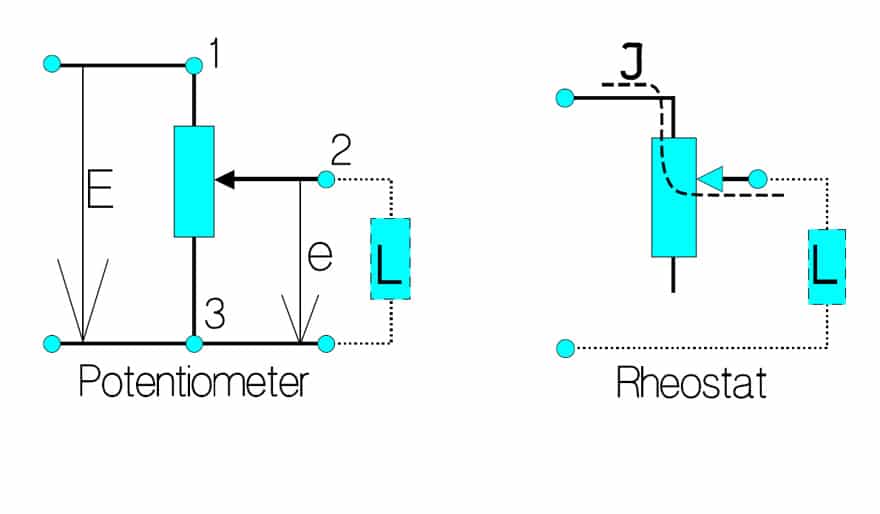
Figure R6-5 shows the principle functions of a potentiometer and a rheostat. The current through the rheostat may never exceed Imax in the formula
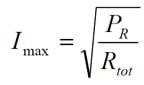
This formula applies also to the potentiometer.
R 4.1.3 Conformity
By means of the resistance track construction the output ratio may be made to follow non-linear functions like, for example, logarithmic, trigonometric etc. In order to specify the fidelity of the output ratio to such functions the concept conformity is used. It stands for permissible, practically determined output ratio deviations from a theoretical function. The conformity is expressed as a percentage of the total applied voltage.
R 4.1.4 Linearity
Introduction
The most common output ratio from a potentiometer is the straight one. Specification of the deviations from a straight reference line is a special case of conformity and has got its own name: linearity. Thus, it describes how well the output ratio follows the shaft travel. The linearity is expressed in percent of the total applied voltage. In the ideal case the output ratio should follow a straight line from 0 to 100% when the shaft is turned from one end point to the other. In practice, however, there are deviations or linearity errors and they may be defined in different ways. Following definition description will gain in clarity if we, for comparison reasons, place a copy of Figure R4-1 in close connection to Figure R4-7. The copy is called Figure R4-6.
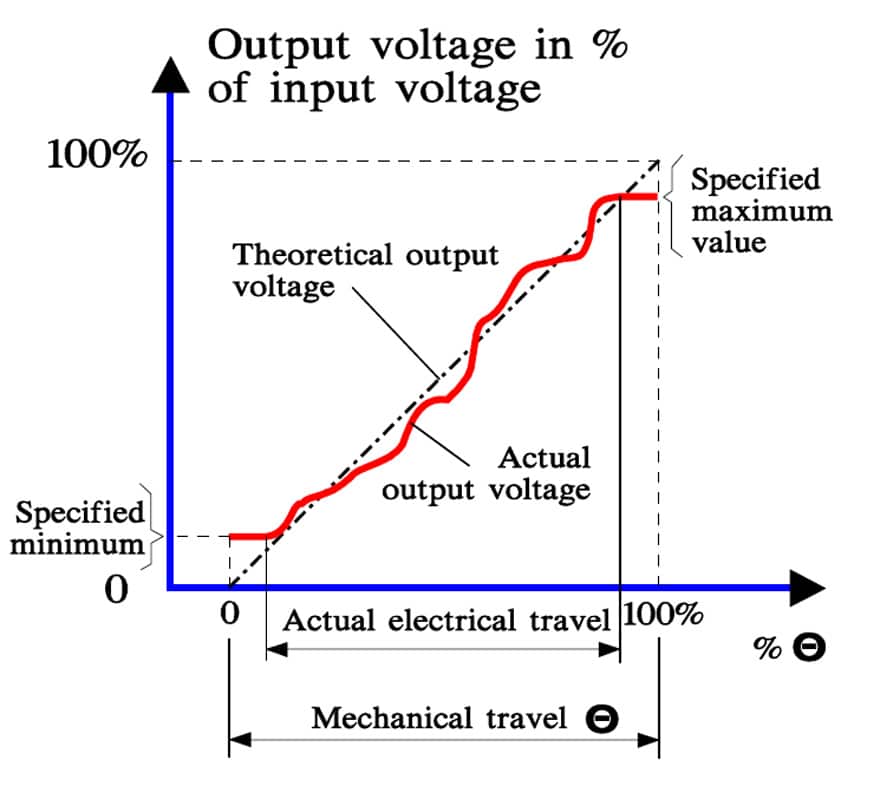
If we turn the potentiometer shaft (2) from one end point (1) to the other (3), the output voltage increases along a line that deviates more or less from the theoretical straight reference line. It may look like the curve in Figure R4-7.
If we compare Figure R4-6 with R4-7 we may imagine how the terminal metallization acts like a kind of landing-strip for the output voltage (the plane parts in the beginning and the end of the actual electrical travel).
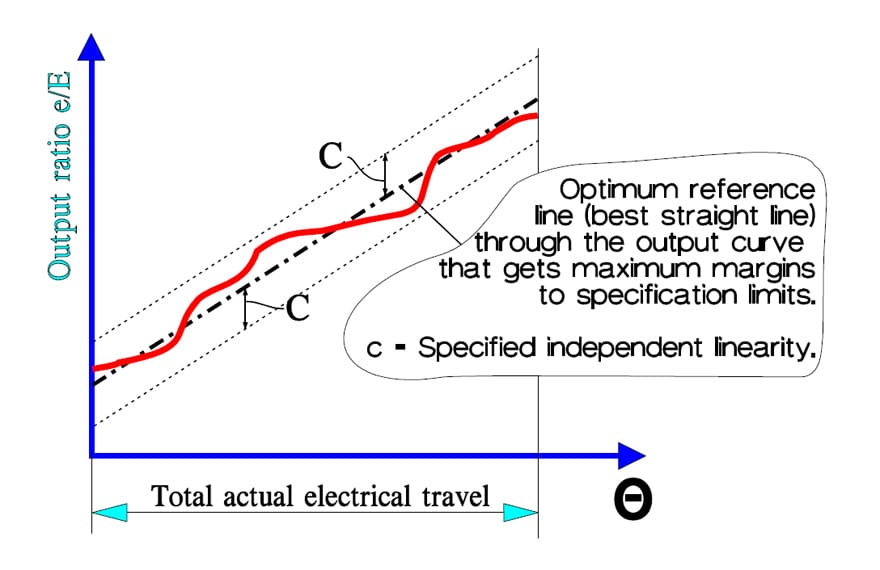
Independent linearity
The least difficult way of defining linearity is by using Independent linearity. Here we restrict ourselves to either total actual electrical travel (wirewound) or to theoretical electrical travel (non-wirewound). An optimum center line is drawn through the output voltage curve together with two parallel specification limits. The margins between curve and limits then will be at maximum. The distances c in Figure R4-8 and R4-9 represent the specified independent linearity and are expressed in percent of the total applied voltage.
Specification of the independent linearity is used, for example, on such potentiometers where the user wants to adjust the gradient of the output voltage. It is done by means of built-in resistor elements connected to the potentiometer track.
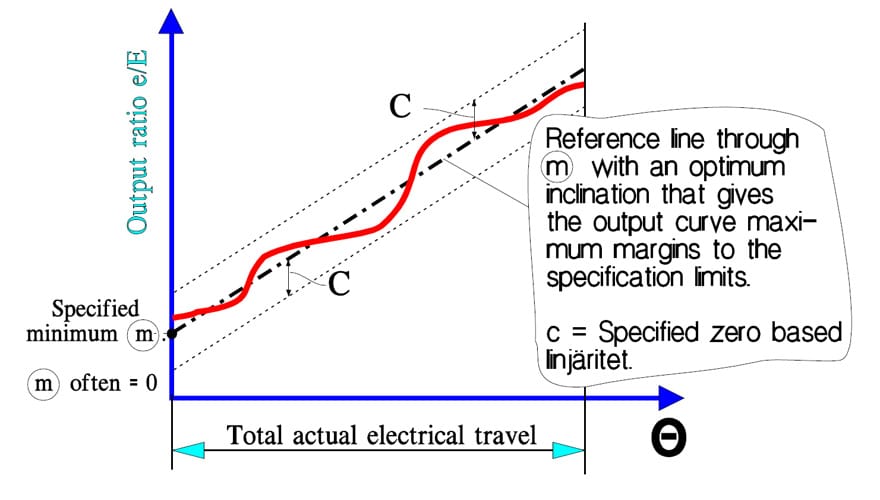
Zero based linearity
If we specify a minimum of the output ratio at the start of the actual electrical travel, draw a center line through this point and choose a slope that minimizes the maximum deviations, we obtain a reference line around which we may draw two parallel specification limits. They represent the zero based linearity and apply to wirewound potentiometers only. The specified minimum usually is zero, therefore the name (Figure R4-10). It is expressed in percent of the total applied voltage.
Terminal based linearity
This linearity expresses the deviations from a center line through a specified minimum and maximum output ratios that are separated by the actual electrical travel. The specifications usually calls for 0 and 100% at minimum and maximum ratios. This linearity is also expressed in percent of the total applied voltage. It applies to wirewound styles only (Figure R4-11).

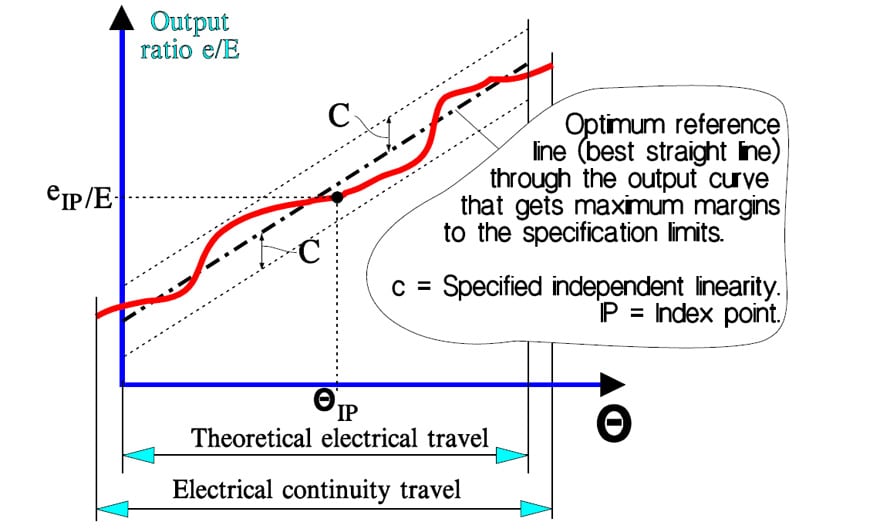
Absolute linearity
This linearity concept differs from the terminal based linearity only by the extension of output ratio records. They range over the theoretical electrical travel which means that an index point is required. Absolute linearity applies to both wirewound and non-wirewounds (Figure R4-12).

R 4.1.5 Taps
Certain applications require additional terminals. These are called taps and exist in both wirewound and non-wirewound potentiometers. In the latter they have either of two functions: Current taps and voltage divider taps. The former ranges over the width of the whole resistance track and disrupt the linearity. The latter are located at the outermost edge of the track and don’t influence the linearity.
R 4.1.6 Gang potentiometers
Sometimes several potentiometer elements called cups are coupled together on a common shaft. The assembly is called a gang. The technique requires some definitions.
Phasing point
In order to meet the requirement of simultaneous conformity or tracking gang cups are phased together at a common reference position of the shaft. For linear potentiometers usually that shaft position is chosen where the output ratio e/E of the electrical elements is approximately 50%.
Tracking
The mutual difference, at any shaft position, between the output ratios of the electrical elements of a gang is called tracking error. It is expressed in percent of the input voltage E. The first potentiometer section is taken as reference. In Figure R4-13 the tracking error of the two sections is Δe.
Simultaneous conformity
If we require that all the potentiometer elements in a gang simultaneously shall meet the requirements of conformity (or linearity) we talk of simultaneous conformity. The best result is achieved if the phasing point is localized at an output ratio of approximately 50%.
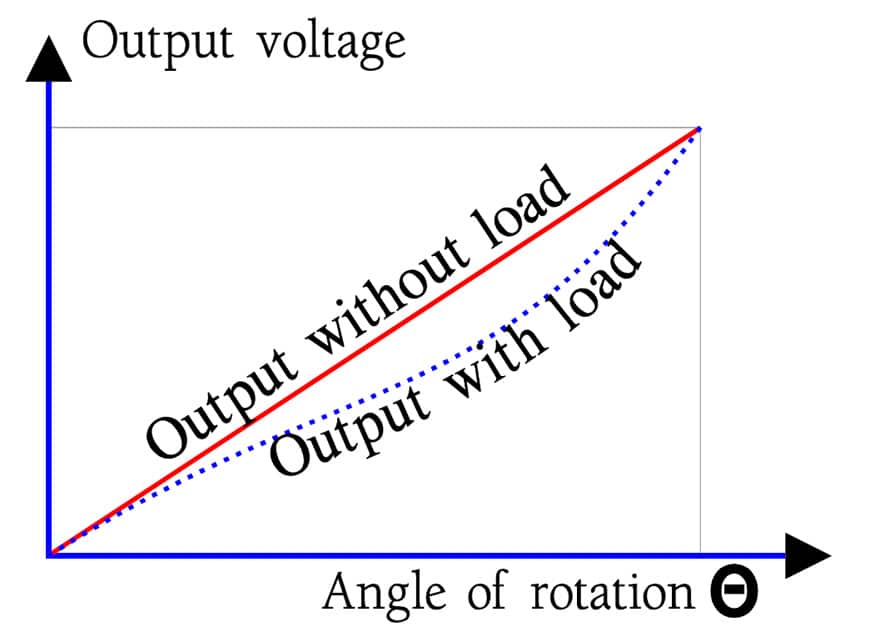
R 4.1.7 Loading error
If we load a potentiometer as shown in Figure R4-14 the load will draw a certain current through the wiper. This will alter the proportionality of the voltage division slightly. The output curve will sag, with a maximum difference from the zero load line at approximately 2/3 of the maximum shaft rotation max. We get a linearity error or loading error. The error decreases with increasing load impedance.
R 4.1.8 Resolution
From MIL-R-39023 we quote the definition of resolution: ”A measure of the sensitivity to which the output ratio of the potentiometer may be set”. The same MIL standard also defines voltage resolution as “The maximum incremental change in output ratio with shaft travel in one direction in any specified portion of the resistance element” (applicable to wirewound only). The resolution is expressed in per cent of the input voltage E. The higher resolution the lower percentage.
Descriptions of non-wirewound potentiometers sometimes discuss “Infinite Resolution”. More literally it should be written “infinitely high resolution”. The resolution of a wirewound potentiometer with N number of turns may be approximated to the reciprocal 1/N.
Adjustability
The resolution of trim potentiometers has the name adjustability, which means setting accuracy or settability. It is stated in percent of the total applied voltage E (or of Rtot) and thus is a measure of the accuracy with which a desired voltage (or resistance) may be set.
R 4.1.9 Potentiometer noise
CRV
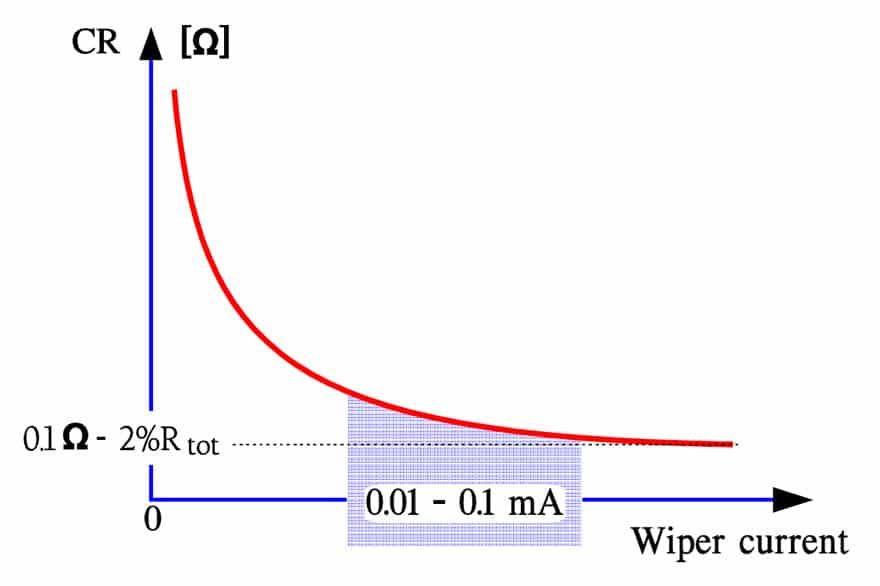
CRV stands for Contact Resistance Variation. Before we discuss this concept let us begin with Contact Resistance in general. The contact between wiper and track has a certain resistance the value of which depends on the contact pressure, the track material and its nature, the current through the wiper, etc. The Contact Resistance (CR) increases, for example, exponentially with decreasing wiper current somewhere below 1 to 0.1 mA. The more metal in the resistance element the less pronounced the phenomenon. Figure R4-15 shows in principle the CR of a cermet potentiometer but the curve could equally well be applied to a wirewound potentiometer.
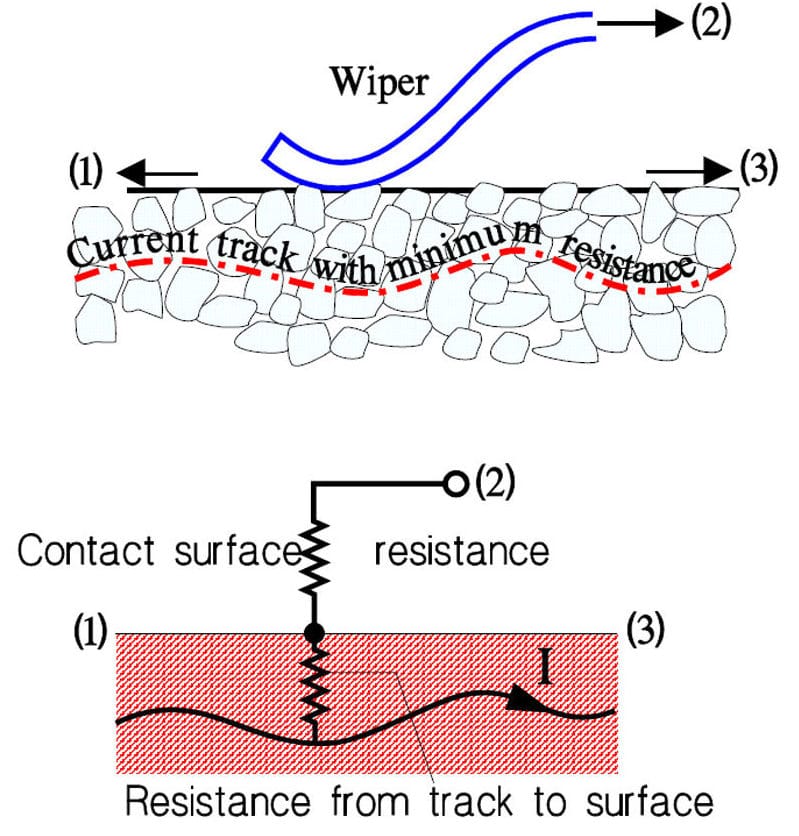
In addition, the wiper current varies from point to point along the travel track. In addition to the contact resistance there is in non-wirewounds also a certain track material resistance (Figure R4-16).
We can call the sum of all these static resistances Contact Resistance, CR. In the end points they are part of the end resistance ER respectively the minimum resistance MR. When the shaft then is moved over the track arbitrary resistance changes or dynamic Contact Resistance Variations, CRV, occur that in principle may look like the record shown in Figure R4-17.
Usually CRV is specified for trim potentiometers and sometimes also for non-wirewound Type 2 potentiometers intended for panel mounting. A test circuit is used similar to the one in Figure R4-18 but with other data. A filter with a bandwidth of 100Hz – 50 kHz is needed. The current must also be adjusted to Rtot. CRV is expressed in percent of Rtot.
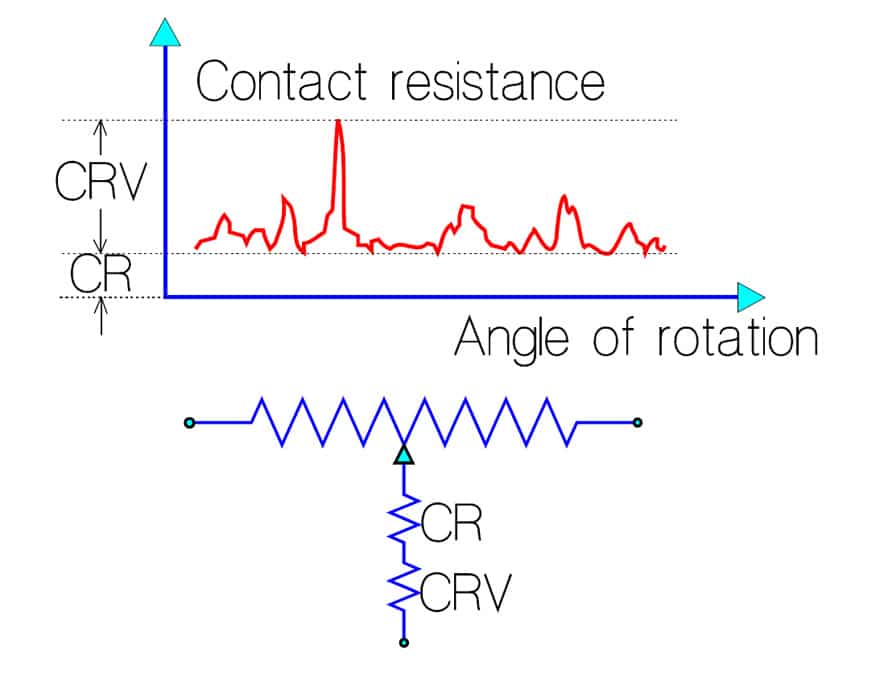
The figure applies in principle to both wirewound and non-wirewound potentiometers. Wirewounds have a fixed contact resistance (CR) that usually lies considerably below 1 ohm. Non-wirewound CRs are in the kohms range (See explanatory Figure R4-16).
ENR
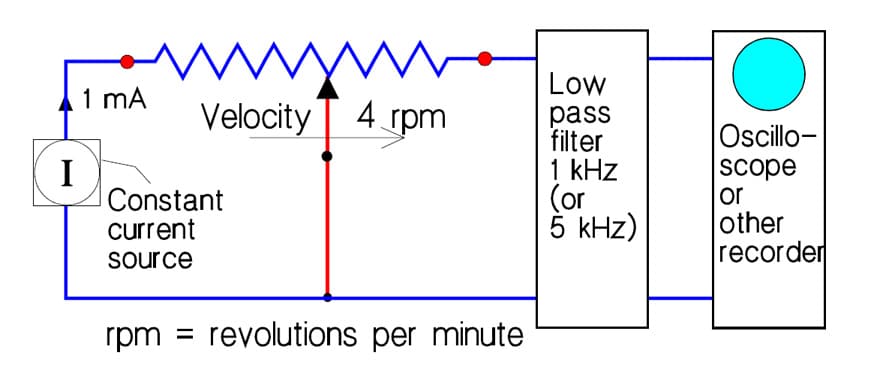
For wirewound potentiometers the Equivalent Noise Resistance, ENR, is specified. Usually it is measured according to the setup in Figure R4-18. The current generator feeds 1 mA through the wiper. The voltage drop across the contact then may be graded directly in ohms (1 mV corresponds to 1 ohm).
The measurement specifications – that are strongly influenced by the manufacturers, though based on a MIL specification – usually also prescribe that the shaft first shall be cycled 10 times over a minimum of 95% of the electrical continuity travel prior to noise measurements. That means that possible oxides and other debris that may occur on the track will be rather effectively worn off, thus giving a relatively insignificant measurements. Values below 0.1 ohm are not unusual. Furthermore the measurements shall be carried out at room temperature. If the application operates below zero the result from the ESR test is not relevant. Faster wiper movements than the specified 4 rpm also will yield a poorer noise result. At production inspection certainly higher velocities occur, as much as 100 rpm for certain designs. But sooner or later such velocities are obtained where the wiper starts bouncing over the turns.
In conclusion: For mutual comparisons between potentiometer types the above mentioned specification is good. ENR information from application conditions, however, may require additional measurements.
Output Smoothness
Output Smoothness means the maximum instantaneous variation of the output voltage compared to the ideal output. This parameter is applicable to non-wirewound precision potentiometers only. The high resistivity of the track material and the geometry of the wiper contribute to a considerably higher contact resistance (CR) than the one in wirewounds. There would be considerable power generated in the CR if we used the test equipment for ENR in Figure R4-18. Instead the test circuit in Figure R4-19 is used.

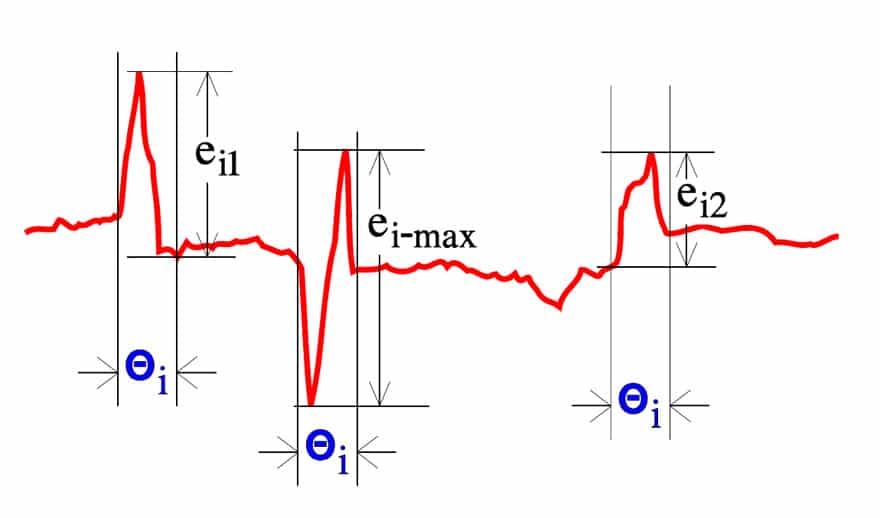
In order to avoid the output voltage gradient the filter blocks DC voltages. The filter time constant is chosen so that only sudden voltage changes during shaft movements shorter than 0.5° are recorded, i.e., ≤20 ms at 4 rpm. The output voltage “e” is measured over the theoretical electrical angle that is divided in intervals of 1%,Θi. If for, example, the theoretical angle is 300°, Θi will be 3°.The interval width is placed over occurring interesting voltage changes as shown in Figure R4-20. Output Smoothness is defined as the maximum output voltage change during one interval. Thus, in Figure R4-20 ei-max = the Output Smoothness of the record.
R 4.1.10 Summary about output voltage errors
The different types of output voltage errors that we have dealt with may be divided into static errors (deviations from the ideal output ratio) and dynamic ones (ENR, CRV and Output Smoothness). The latter are superimposed on the static ones as shown in following schematic.

R 4.1.11 Some mechanical definitions
The following formalized figures indicate the principle methods for determining mechanical properties. Different standards may state deviating forces and measures. US military specifications state, for example, ½ pound instead of 2 N and the distances are stated in inches (25.4 mm). The circle with a pointer symbol refers to a dial indicator for recording of mechanical movement. The figures are designed to be fully descriptive. Further detailed instructions have to be found in the standard in question.


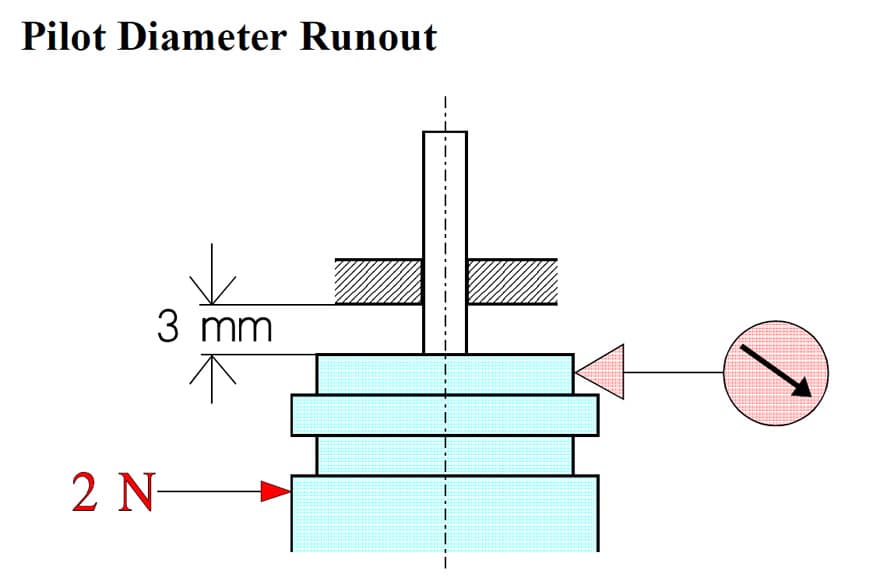
Figure R4-22-26. Shaft End Play; Runout; End Play; Lateral Runout; Pilot Diameter Runout
Backlash
If we turn the shaft in one direction until the output voltage has attained a specified value that we call e1 at a travel angle Θ = α1 and continue the movement a little before we turn back, we have to pass α1 a certain way before we attain e = e1. This will happen at a travel angle Θ = α2 and depends on mechanical play in the wiper system. Backlash is defined as the maximum difference between α1 and α2 and thus is expressed in degrees. The case is illustrated in Figure R4-27 and describes a mechanical hysteresis.
