
Wet Aluminum Electrolytic Capacitors
C 3.3 WET ALUMINUM ELECTROLYTICS
C 3.3.1 Introduction
Wet aluminum (Al) electrolytic capacitors continuously generate hydrogen gas under operation, even under a small residual charge. (note: if capacitors are stored voltage-free no hydrogen is being released during storage). That hydrogen must be able to diffuse and exit the package or it will rupture. Thus conventional wet Al electrolytics must not be hermetic sealed. The diffusion takes place through the non-hermetic lid that usually has a rubber packing in the pressure seal against the can edge.
Larger size cans are also supplied with a safety vent that provides for relief in the instance of very critical gas generation. There are also special, high reliability hermetic Al electrolytic available on the market based on improvements of electrolytes and gas absorbing compounds.
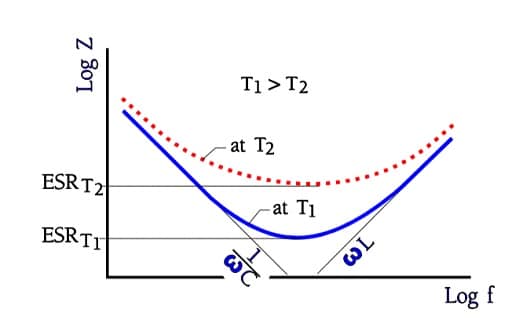
In catalog sheets for different electrolytic types it’s usual to show impedance versus frequency at different temperatures. The axes are given a logarithmic scale and look in principle like the one in following figure where the ESR at several temperatures can also be read.
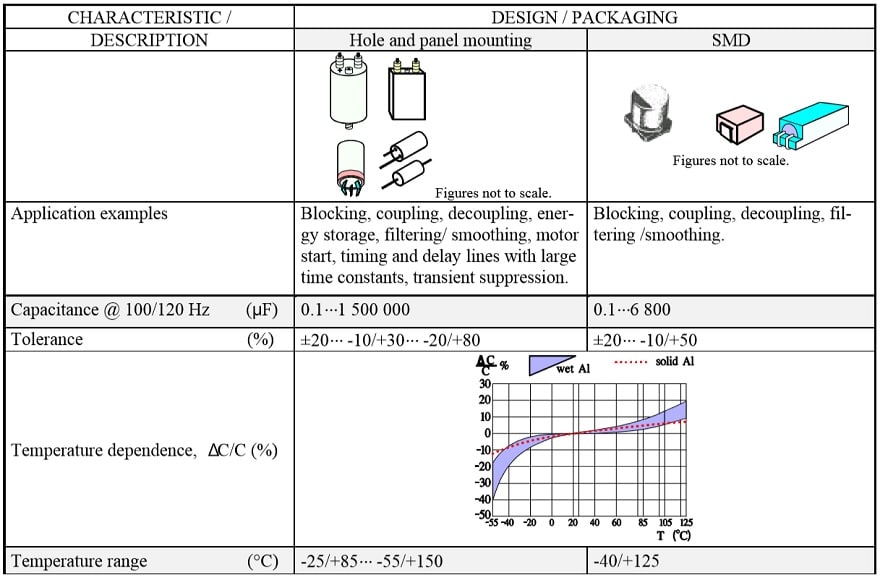
The capacitance stability versus time and temperature is comparatively inferior to the other capacitor technologies. The most common standard tolerance is ±20% in E6 range.
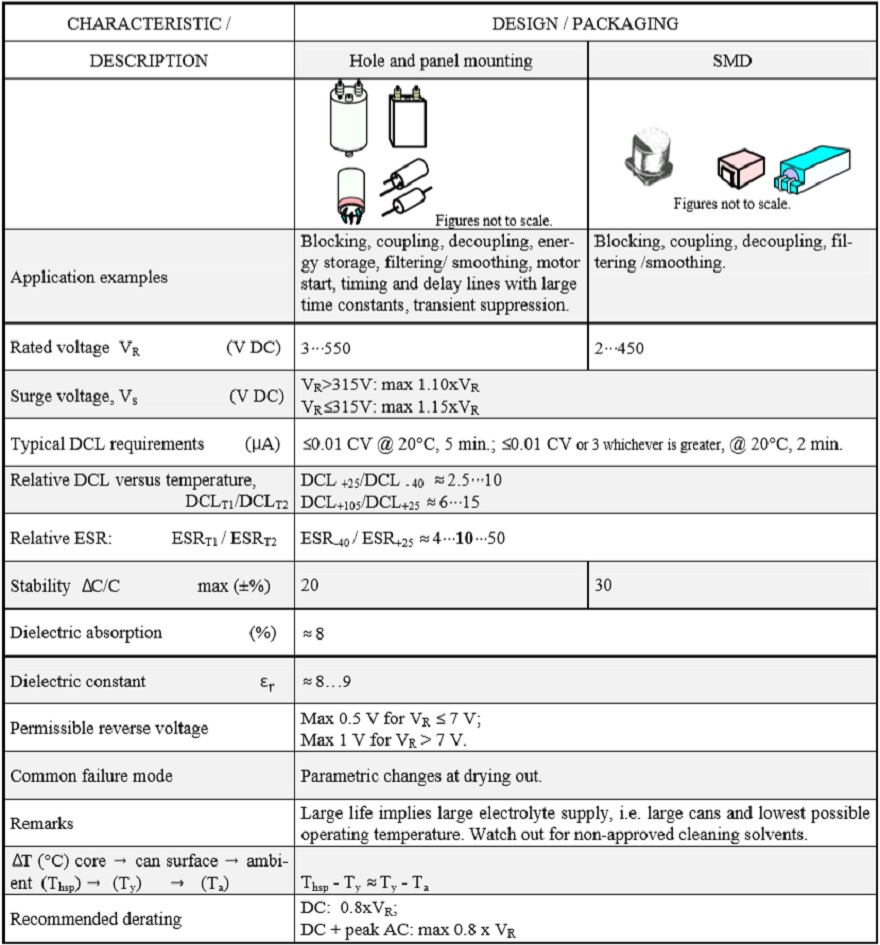
Generally, no reverse voltage is permitted. Manufacturers may permit a certain reverse voltage in the type specification, to allow diode “overshoot” reverse voltage operation.
Example of maximum permissible reverse voltage (please check the specific manufacturer datasheet):
- 0.5 V for VR ≤ 7 V
- 1 V for VR > 7 V
The reverse voltage figures apply up to the rated temperature. Then a proper derating is recommended. Losses often are large and strongly temperature and frequency dependent. Figure C3-24 shows how the impedance versus frequency curve at increasing frequencies approaches and finally reaches the ESR contribution at temperature dependent levels. This occurs somewhere between 1 to 100 kHz, depending on capacitance size and temperature.
Recent examples of new solid-polymer or hybrid electrolytes with improved electrical conductivity present on the market. Nevertheless, the conventional wet Al electrolytic capacitors are one of the lowest cost capacitor technologies on the market and still under high volume use or in higher voltage applications where there is no polymer/hybrid electrolyte alternatives.
Examples of some typical applications of wet Al electrolytics are as follows: smoothing, filtering in Switched Mode Power Supplies (SMPS; low ESR necessary), inverter DC-link capacitors, coupling/decoupling , energy storage, timing and delay circuits with large time constants.
C 3.3.2 Properties
Capacitance versus temperature
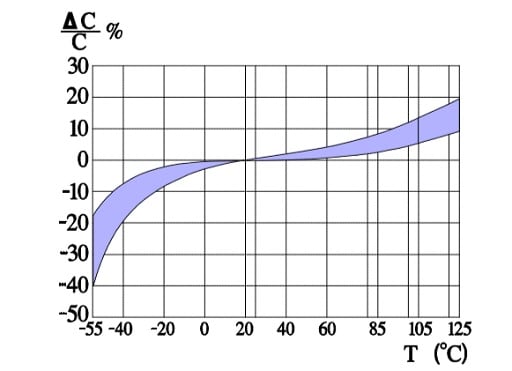
Figure C3-25 shows a strong capacitance deviation at lower temperatures. It is caused by the increasing resistivity of the electrolyte. Note that the temperature ranges vary and with that the temperature dependence of corresponding electrolytes also varies. Some types can withstand –55/+150 °C, others only –25/+85. Most common temperature ranges are –40/+85 and -40/+105 °C.
Capacitance versus frequency
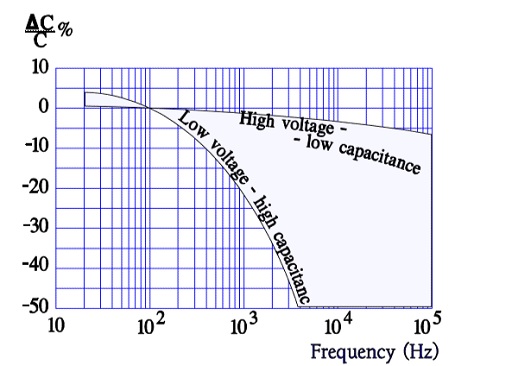
Note in Figure C3-26 how the low voltage – high capacitance, characterized by large foil surfaces and finer etching, demonstrates a higher frequency dependence while the opposite decreases this dependence.
Tan δ versus temperature
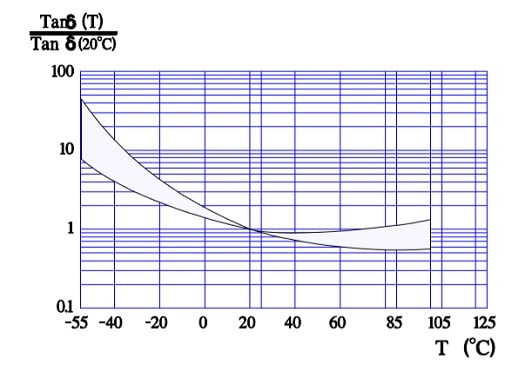
Figure C3-27 shows the normalized Tan δ value, i.e., the multiplier for Tan δ compared with the reference value at 20 °C. Thus, according to the curve, in worst case Tan δ 55°C is approximately 50 times larger than Tan δ+20°C.
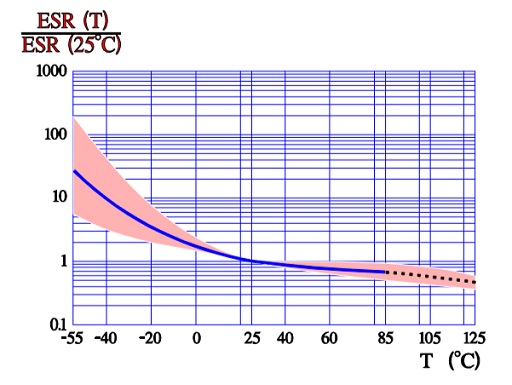
ESR versus temperature
According to the formula Tan δ = ESR x ωCs which means that at a fixed frequency the ESR versus temperature curve will have the same appearance as the one of Tan δ (Figure C3-28).
ESR versus frequency
In Figure C3-29 the ESR versus frequency is shown as a ratio between the 100 Hz value and the ones at other frequencies (a multiplier of the reference value). It applies at room ambient temperatures and above and will differ slightly at lower temperatures. The strong slope of the curve range at lower frequencies depends mainly on the oxide losses.
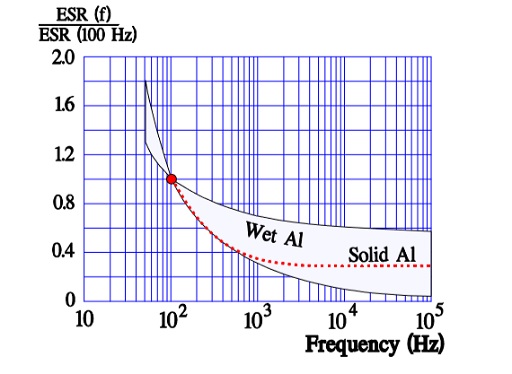
Just for caparison a typical curve also for solid Al is shown.
ESR and ripple currents
In filter applications the capacitors will conduct considerable AC currents caused by superimposed ripple. The ripple current creates heat in the capacitor ESR. Therefore a maximum ripple current IR-max is specified at reference conditions: 100 or 120 Hz and at some higher temperature, for example 85 °C or the upper category temperature Tuc (Figure C3-25). With reference data in the data sheets as a starting-point it is then possible to convert these values to operational condition values.
The maximum ripple current is specified to create a generated average core temperature rise of defined value ( 5 or 10 °C typically) above the allowable maximum ambient temperature. Please note that the actual allowed temperature rise can depend also on the chosen design and it can be manufacturer/product/series/case specific.
When the ripple current frequency rises, the ripple current capability increases. That depends on a corresponding decrease of the ESR (Figure C3-29) that has a negative TC, mainly caused by the electrolyte, and this will consequently lead to a decreasing ESR when the temperature rises (for example, at higher ripple currents) (Figure C3-28).
If we, for example, specify an IR-max at 100 Hz and permit 1.4 x IR-max at 10 kHz this is possible just because ESR10kHz ≈ ½ESR100Hz.
For (1.4 x IR-max )2 x ½ ESR100Hz ≈ 2 x ½ x (IR-max )2 x ESR100Hz = (IR-max)2 x ESR100Hz.
Nevertheless, please bear in mind that manufacturers can guarantee only what they can 100% measure – it means the catalogue ESR value at 10kHz or 100kHz in case of aluminum capacitors. The ESR versus frequency characteristics presented in specification datasheets or simulation models may be specific to types and manufacturers and are “typical” (not guaranteed) behaviour.
Leakage current versus temperature
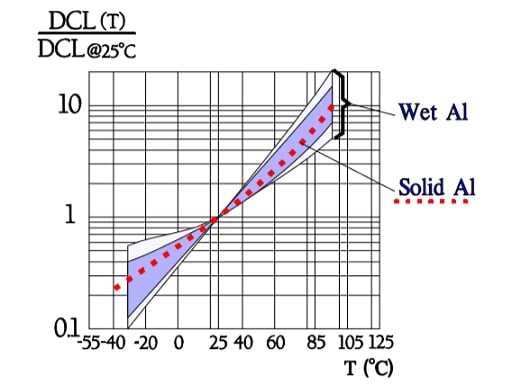
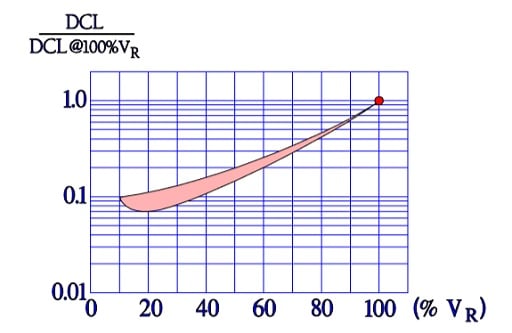
Also the important parameter leakage current varies with the environmental conditions. When temperature increases from the lower to the upper limit of the temperature range, leakage current rises approximately two orders of magnitude (Figure C3-30). Next figure shows the ratio of DCL versus applied DC voltage and DCL at 100% VR.
Leakage current versus DC voltage
C 3.3.3 Heat generation
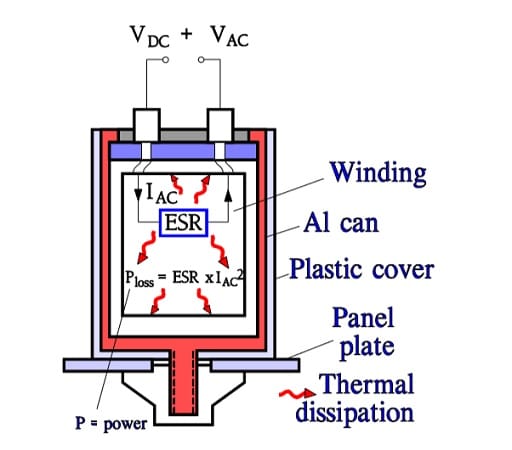
Aluminum electrolytics also are manufactured with high CV products in correspondingly large cans. If they are loaded with a superimposed ripple voltage heat generation from the power ESR x IAC2 might be troublesome. The rise of temperature will be largest in the center of the winding, i.e. the capacitor Hot Spot, and must not exceed certain values. Therefore a maximum AC current value is specified at 100 or 120 Hz and sometimes also at 20, 40 or 100 kHz. Furthermore it’s usual to state the maximum ESR at these frequencies. A schematic of the heat generation principle is shown in Figure C3-32. The components of ESR are shown in Figure C3-33.
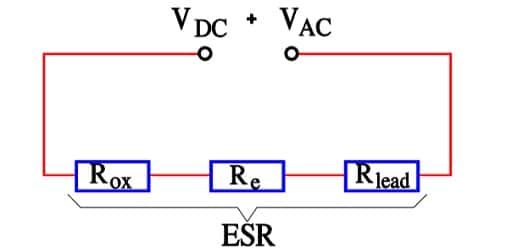
- Rox = resistance in the dielectric oxide layer
- Re = resistance in the electrolyte and paper separator
- Rlead = resistance in electrical conduction paths.
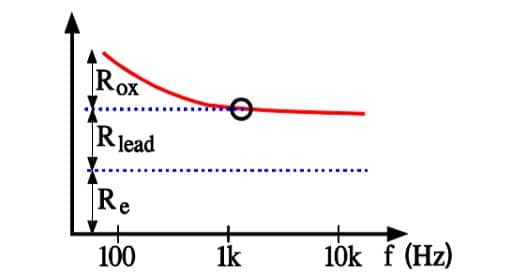
Above all it’s the dielectric oxide losses that are frequency dependent and cause the general appearance of the ESR curve shown in Figure C3-29. In more detail the frequency dependence can be illustrated as in Figure C3-34 where one can note how the oxide losses, on the whole, end above 1.5 kHz.
There are for high-reliability styles information about their thermal capacitance and resistance. If we know the can and ambient temperatures then the Hot Spot temperature of the capacitor can be calculated more thoroughly. A less accurate but more simple calculation says that
Thsp – Ty » Ty – Ta⋅⋅⋅⋅⋅⋅⋅⋅⋅⋅⋅⋅⋅⋅⋅⋅⋅⋅⋅⋅⋅⋅⋅⋅⋅⋅⋅⋅⋅⋅⋅⋅⋅⋅⋅⋅⋅⋅⋅⋅⋅⋅⋅⋅⋅⋅⋅⋅⋅[C3-1]
Where:
- Thsp = Hot Spot temperature
- Ty = surface temperature of the can
- Ta = ambient temperature (Figure C3-35)
C 3.3.4 Life calculation
The Life (L0) for a wet Al electrolytic is stated in the catalog sheets as the number of hours at the maximum temperature. If, for example, the stated L0 = 2000h @ 85 °C, we get the Life at 35°C by means of the formula as

Thus the formula says that Life is doubled for a temperature decrease ∆T = 10 °C. We repeat that the formula is just a rule of thumb (Arrhenius relationship) and no accurate calculation.
Also, ambient temperature shall also include influence of self-heating due to the ripple current. In more general form the equation will be expressed as:
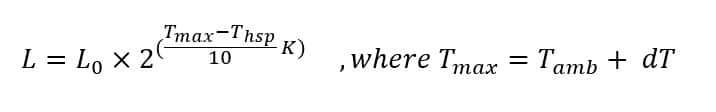
dT is the temperature rise due to the applied ripple current.
C 3.3.5 Mounting
Large can electrolytics with a safety vent preferably should be mounted in an upright or horizontal position, thus preventing electrolytic liquids from obstructing any gas diffusion. More details about mounting guidelines can be found in reference spec CENELEC CLC/TR 50454 that has being revised and updated by IEC TC40XA. Some aluminum mounting tip and tricks can be also found in ABC of CLR Mounting Guidelines.
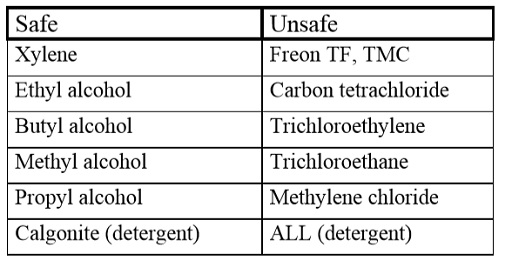
C 3.3.6 Cleaning solvents
Penetrating contaminations, especially from halogenbased washing agents, sooner or later may lead to a short circuit. Exposed to an electric field they will be converted electrochemically to free chlorides that will cause corrosion, a subsequent increase in leakage current and finally a short circuit. Because destruction takes place only when the capacitor is electrically operated, failures unfortunately occur only in the field and after some time. In order to avoid a suction effect during the washing one shall make sure that the component has a lower temperature than that of the washing bath.
C 3.3.7 Failure modes
The most common failure is drying escape of the electrolyte. Drying first manifests itself as a high ESR. For it’s not only hydrogen gas that diffuses through the sealings to the lid of the aluminum electrolytic. The electrolytic liquid also diffuses through the non-hermetic lid. One leading manufacturer has solved this problem to a great extent by utilizing rubberized laminated paper washers instead of conventional rubber seals. However, diffusion and hydrogen development will take their tribute. Gradually the electrolyte dries up and left will be only a kind of resistor.
Experiences indicate that an electrolyte loss of 20% increases the ESR approximately 100%! The wet Al electrolytic capacitor is the one component type that has the most distinct life limitation. Beyond a certain time the capacitor ceases to be a capacitor. At tests performed at the maximum temperature one may get an idea of the diffusion rate and thus the life by weighing the part and calculating the electrolyte loss during the test. Wet Al electrolytics in chip design had some problems when they first were introduced on the market. There were examples of how certain types lost half of the electrolyte supply during the soldering process.
Now these problems certainly are overcome, but make sure the manufacturer is in command of the difficult manufacturing process of chip sealing. Open circuits caused by fatigue fractures in internal contact strips between winding and terminals during vibration/bump are not too unusual. Chloride contamination of foils from clammy hands or penetrating cleaning agents can cause high leakage currents and finally short circuiting.
Acknowledgement
This chapter was contributed by Dr. Arne Albertsen, Jianghai Europe Electronic Components GmbH