Supercapacitors – Features & Measurement
During this topic we will have a look into basic behavior of supercapacitor parameters. Some of them may be difficult to measure by conventional capacitor measure bridges, so it is good to mention also some note on measurements.
C 4.4. The time constant, t
The time constant of electrostatic capacitors is defined in section C1.2.2 as the time needed to discharge a loaded capacitor through the insulation resistance (IR) to 1/e (~37%) of the initial voltage. This constant denominated t(tau) is the product of IR and C (capacitance), usually abbreviated RC. As already mentioned supercapacitors don’t have any dielectric even if the true leakage cur-rent represents a kind of “internal DC resistance”. What is of importance with supercapacitors is their ability to absorb and release electric charges. This depends on their ESR. The more conductive the electrolyte and the better construction that facilitates the current flow, the lower is the ESR and consequently the faster the charge and discharge time.
The time needed to charge/discharge a supercapacitor is called its time constant, t, where t is the product of ESR and C. Note the difference between t in electrostatic capacitors (IR x C) and t in supercapacitors (ESR x C). In accordance with t of electrostatic capacitors t is the time needed to charge/ discharge a supercapacitor to 1/e of its initial voltage.
While we for electrostatic capacitors esteem high time constants we for supercapacitors want as short time constants as possible. Some types of supercapacitors have considerable time constants while especially power-burst designs are characterized by very small ones, ranging from milliseconds to minutes.
C 4.4.1. Energy density (Wh/kg) and power density (W/kg) of EDLCs
Electrochemical capacitors have compared to conventional electrolytic capacitors approximately 10-100 times higher energy density (also called specific energy) expressed in Wh/kg. If we compare with conventional electrostatic capacitors the specific energy is approximately 100 times higher. Despite supercapacitors are subjected to fast developments, batteries still may have typicaly 10 to 100 times as much energy density (as battery development is also significantly moving forward).
Comparisons on power density show another picture. Electrochemical capacitors having considerable ESR values and time constants of 1 to 100 seconds equal batteries with respect to power density. They in recent years marketed power supercapacitors can deliver 10 times the power of conventional batteries or with latest graphene electrode design can get very close to electrolytic capacitors. Their time constants range from below 0.1 second to 30 seconds.
C 4.4.2. Applications
As already mentioned in the introduction supercapacitors seem to be very reliable claiming a service life widely exceeding 10 years. Together with capabilities of charge/discharge cycles ranging to millions they offer maintenance free products of high interest, especially when combined with rechargeable batteries. They have a high power density and their capacitance range from several farads to several thousand farads which make them perfect for high power-burst applications. Nevertheless watch for low end “no-name” supercapacitors as there are also “cheap” technologies on the market with significantly worse capacitance drop versus cycles/life time or operation at higher temperatures.
High power-burst application can be divided into two categories. The first one is small-cell designs. They belong mainly to applications like digital cameras, wire-less PCs and the like where they are used to load-level pulses from such energy sources as batteries and fuel cells.
The second category is large-cell types. They will be found in for example automotive applications and as UPS (uninterrupted power supplies) in industrial applications. Whether it is small-cell or large-cell supercapacitors utilized in power-burst applications they will relieve the battery of pulsed power functions. That means possibilities to utilize smaller power batteries.
In electrical vehicles (EV) and hybrid electric vehicles (HEV) combination of batteries and supercapacitors is providing high power immediate capability and longer energy supply. Supercapacitor are also popular solution for start-stop systems that is integrated in vehicle energy recuperation energy management system to lower emission and consumption of combustion engine vehicle (CE) and HEV. As already mentioned these supercapacitors can deliver more than 10 times more power than the batteries. Especially at lower temperatures, where the supply of power from batteries might be quite insufficient supercapacitors can be the solution. Some of them can operate successfully down to –40°C. Batteries have very limited power in cold and the supply of power for starting may be quite insufficient. They can on the other hand trickle-charge the supercapacitor that in turn has the power necessary for starting.
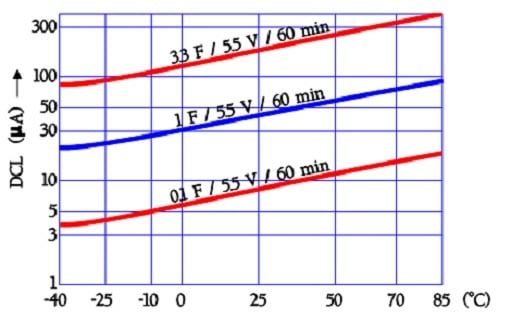
Many of these supercapacitors can be discharged down to 0 V. On the other hand, one major limitation of supercapacitors that is blocking complete replacement of batteries in combustion engine vehicles is their higher self-discharge/DCL and its significant increase at higher temperatures – see further bellow and illustration in chart C4-19.
C 4.4.3. Charge and Leakage currents
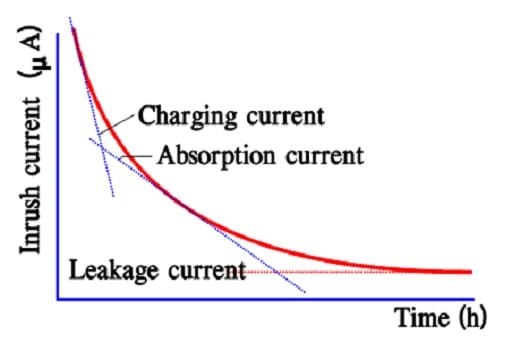
In aqueous electrolyte constructions as well as in some organic electrolyte types we could, with respect to time, distinguish three different types of current components:
a) a charging current, Ich,
b) an absorption current, Iabs,
c) a leakage current, DCL.
The charge current charges the different capacitor elements. A large part of this “operating charge” can take place within fractions of a second but the exchange increases if we extend the time to minutes or even more. Even if ESR limits the surge current at rapid charges/ discharges, a current limiting resistance in the same magnitude as the ESR is recommended for use.
As was seen in the previous section there is a very large distribution of time constants for the different capacitor elements. The most inert ones never will be charged within a reasonable time. Once they are charged they won’t participate in discharges taking place under a certain practical time. They have been absorbed. The absorption process is characterized by the so called absorption current during charging.
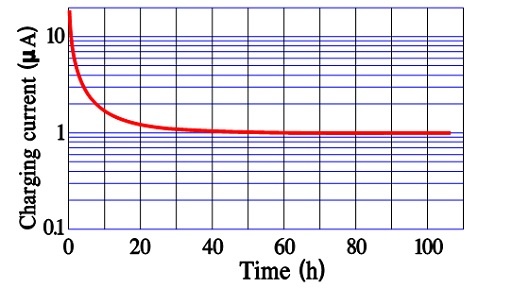
After a very long charging time we reach a limit for all charging currents. There is left a current, the true leakage current. In reality it is independent of time since it exists all the time. Figure C4-10 and –11 show examples of the three current components and their time dependence.
In modern power supercapacitors the charge/discharge times are so small that there is no significant difference between the first two current components discussed above.
C 4.4.4. Measurements
Leakage current
The leakage current, DCL, sometimes is called bias current and is specified after 10, 30 or 60 minutes of applied rated voltage. As can be seen by Figures C4-10 and C4-11 these times actually are too short for a true DCL determination. For reciprocal comparisons, however, they serve their purposes.
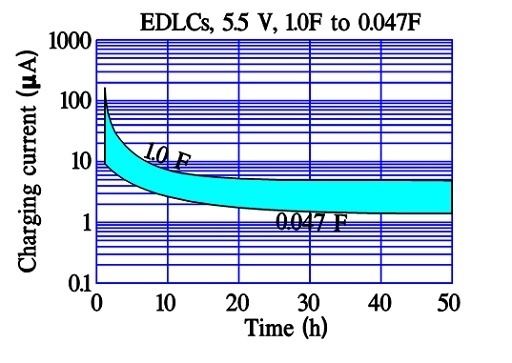
It is remarkable that some manufacturers of power supercapacitors (where the charge/discharge time is specified from 0.3 to 30 seconds) specify DCL measurements after 12 or 72 hours of applied rated voltage.
Capacitance
In spite of decreasing ESR values in modern designs AC measurements of capacitance is regarded to be in-accurate. Instead a discharge with constant current is resorted to (Figure C4-13).
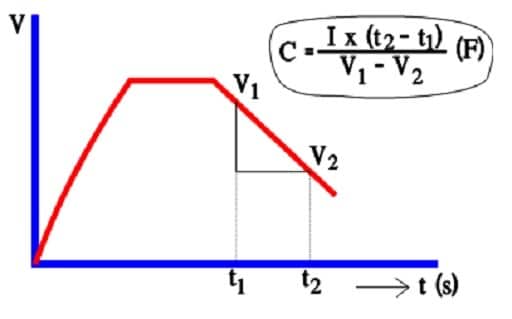
The capacitance determination is based on the fundamental formula Q = C x V. But, at constant current Q = I x t.
That means that according to the figure: C x (V1-V2) = I x (t2-t1).
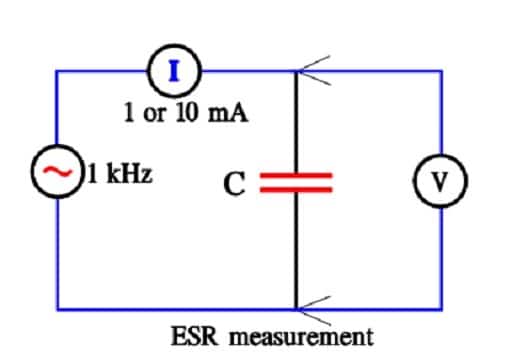
ESR
ESR is measured at 1 kHz and at a constant current of 1 or 10 mA.
C 4.4.5. Life calculations
Estimated life versus voltage and temperature is mostly specified by supercapacitor manufacturers as follows, neverheless it can be specific to the supercapacitor technology, so it is recommended to check the manufacturer datasheets.
Roughly the life will be reduced with more than 2 times (more accurate 2.23 times) for every 10 degree C increase. If we use the formula G3-1 it should be written:
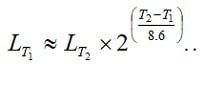
(G3-1)
Life dependence of working voltage can be expressed with the formula G3-2. Because we deal with electrolytics the exponent is significantly higher than that of electrostatics, i. e., n » 17, which gives us the following equation:
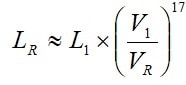
(G3-2)
According to the manufacturer’s graphs (and the formula above) there will be an approximate halving of life for every 4.4 % voltage increase above VR and a corresponding life increase for derating with 4.4 %.
C 4.4.6. Environmental operation risks
Avoid use with:
* environments with a high RH
* corrosive gases
* cleaning agents with Freon TMC or Trichloro-ethylene.
C 4.4.7. Characteristics
The discharge course
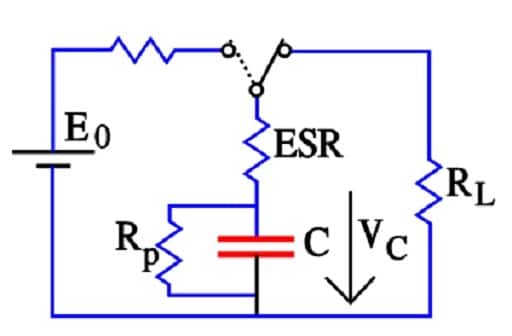
At a discharge of the capacitor the voltage follows the equation
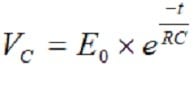
(G3-3)
, where:
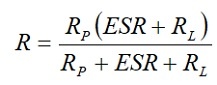
(G3-4)
But at 1 to 100 mA load RL >> ESR and Rp >> RL. Then R ≈ RL and the discharge time t = – CRL ln(VC/E0). Semiconductor memories on the other hand will draw less than 10 *A. In these cases RL >> ESR and
R ≈ RpRL/(Rp+RL).
The following diagram is taken from either of the established manufacturers and may differ between the manufacturers.
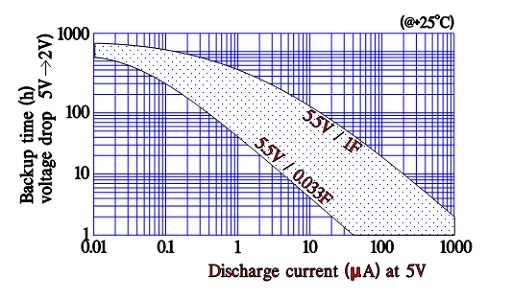
Discharge current versus back-up time
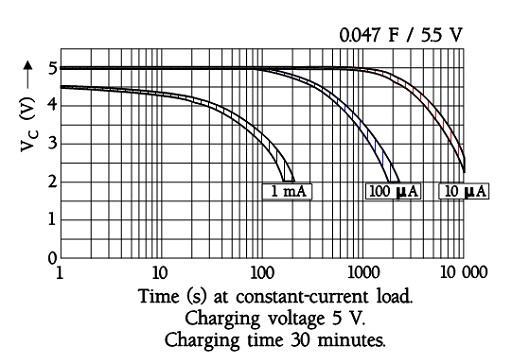
Manufacturers of supercapacitors used for back-up purposes specify voltage versus back-up time/holding time for different discharge currents. The time is related to discharge from rated voltage down to 2 V (where its back-up function ends).
Discharge conditions
The following figure shows a diagram of constant-current discharge curves for a EDLC supercapacitor with an ESR of maximum 120 ohms at 1 kHz. Note the sudden voltage drop of 0.5 V in the 1 mA curve. It is related to the internal DC resistance. At 0.1 mA it is not visible.
Discharge curves for ultracapacitors with small ESRs exhibit straight discharge curves. Fictitious curves for a large supercapacitor capable of a discharge to 0 V may have the following appearance where the discharge currents are called Y and 2Y (A).
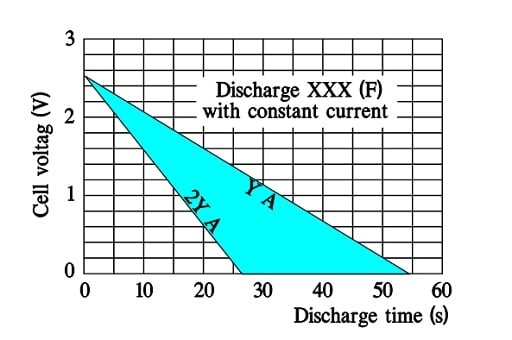
Note that a doubling of discharge current means a halving of the discharge time.
Self-Discharge
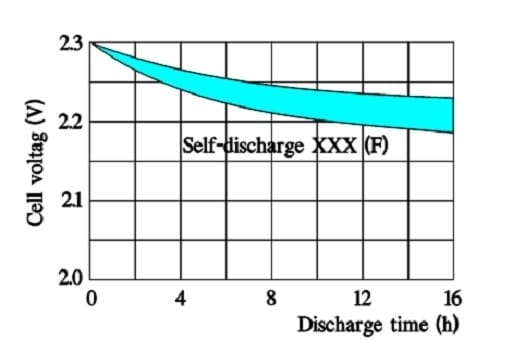
The internal leakage of electric charges will gradually decrease the initially applied voltage. The following two figures illustrate the phenomenon.
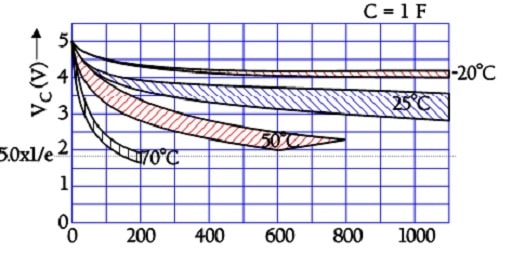
In the above figure we can see that the time constant, – i.e., the time it takes for the voltage to drop to 1/e of the initial voltage, – is very large even at +70 °C. Larger supercapacitors characterized by lower ESR values may have the following self-discharge curve. Always consult the manufacturer for accurate specifications.
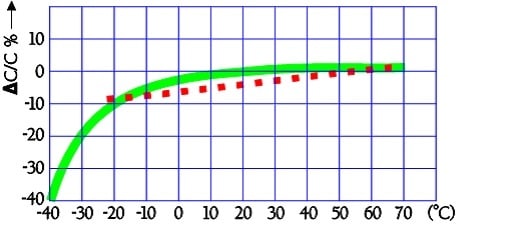
Temperature dependence
The typical capacitance dependence of temperature may look like the following curves in Figure C4-21.
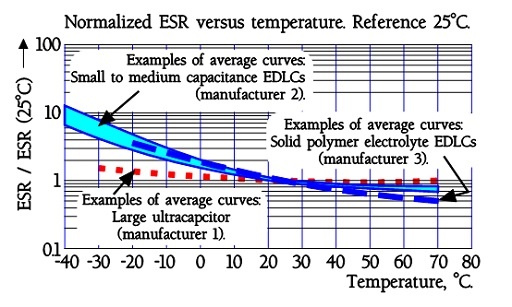
The quotient ESR-25°C / ESR+20°C will be ≤ 5. Larger modules are specified ESR-25°C / ESR+20°C ≤ 10.
The following diagram shows curves for temperature dependence of the leakage current in older aqueous electrolyte capacitors. Because the fundamental double layer construction is valid also in newer EDLCs we have reason to believe that the temperature dependence is still present even if the magnitude may differ.
The leakage current examples in Figure C4-23 are based on readings after 60 minutes of electrification with 5.5 V dc. Charging for 10 or 30 minutes will of course give other values.
The quotient DCL70°C /DCL 20°C will be ≤ 4.