
Concept of Electrolytic Capacitors Measurement
C 3.2 CONCEPTS AND MEASUREMENTS
C 3.2.1 The CV product
The product CR x VR is called the CV product and is a measure of the charge quantity. CR is expressed in µF and VR in volt. The product has the quantity µAs or µC (microCoulomb).
C 3.2.2 Leakage current / DC Leakage (DCL)
The leakage current (DCL) in electrolytics increases linearly as DC voltage is first applied. But when the DC voltage exceeds the rated voltage of the part the DCL increases upwards exponentially and will at the forming voltage achieve very high values. Increases in temperature also force the DCL up (Figure C3-19).
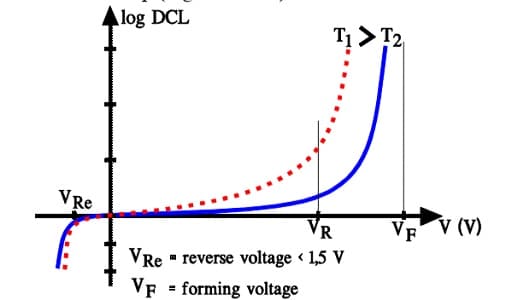
Figure C3-19. DCL versus voltage and temperature.
DC leakage measurements are specified at rated voltage and at room ambient conditions, usually 20 or 25 °C.

Figure C3-20. Charge circuit for a capacitor.
If we charge a capacitor as shown in Figure C3-20 the current will follow the schematic curve in Figure C3-21.
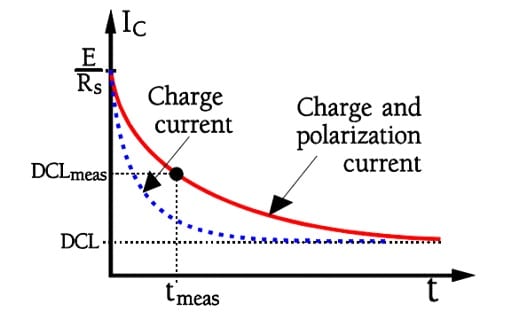
Figure C3-21. Inrush current upon charging of an electrolytic capacitor.
In sections C3.2.1 and C3.2.2 we talked about dipoles and dielectric absorption. Inert dipoles need some time to align themselves in the electric field direction. As long as the alignment proceeds the capacitance increases and with that the need for further charge contributions, i.e. current. There are inert molecular complexes in the electrolyte, in the paper separator and in the dielectric oxide.
Aluminum electrolytics have a dielectric absorption of about 8 %, tantalums approximately 8-10 %. This value of course influences the charge current in an electrolytic capacitor. Thus it will present the appearance shown in Figure C3-21. The time to achieve a pure leakage current amounts to days (at room ambient). Of course, it’s impossible to wait that long. Therefore, in common standards the measurement time is specified to be 5 minutes with rated voltage applied at room ambient (20 or 25 °C). Shorter times occur.
Japanese manufacturers often specify 2 minutes. For production control shorter times are typically used with go/no go measuring equipment. Figure C3-22 shows typical comparison curves for DCL and its temperature dependence at a certain CV product for different types of tantalum electrolytics. Note that a typical DCL is approximately one order of magnitude smaller than the specified maximum value.
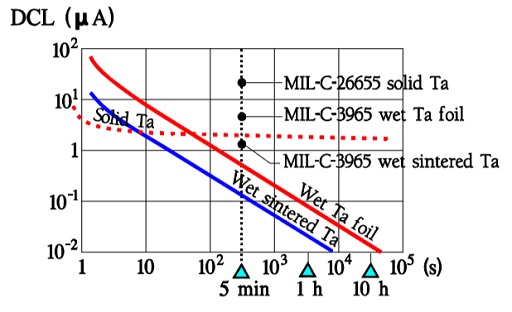
Figure C3-22. DC Leakage versus time in tantalum electrolytics.
Similarly the 5 minute values for Al electrolytics is at least one power smaller than the specified limit. Should one need to make use of the actual low DCL value one has to check with the manufacturer for the probability of greater deviations from the production mean value and also the margin between the 5 minute values and the final value (perhaps an order of magnitude).
C 3.2.3 Losses
With reference to Figure C3-10, the losses in wet Al electrolytics consist of contributions from electrolyte, dielectric and metallic tabs and foils:
• Rs = losses in the dielectric (oxide layer) and in foils and tabs.
• Re = resistance in electrolyte and separator foil.
• ESR = Rs+Re.
A contribution to Rs is the number and location of the connecting Al strips that are welded to the winding electrode foils. Figure C3-23 shows examples of optimum arrangements.

Figure C3-23. Foil resistance examples versus location of the terminal ribbons.
For all types of electrolytics the conductivity of the electrolyte plays a crucial part in the losses. Furthermore, this contribution increases with an increasing degree of etching. The deeper the pores, the larger the electrolytic resistance in series with the capacitance elements. All this together means that the dissipation factor of electrolytics will be high and increasing with decreasing temperatures. But the search for low ESRs, not the least for wet Al electrolytics designed for Switched Mode Power Supplies (SMPS), has brought forth new constructions and electrolytes with lower resistivity. ESR in wet Al electrolytics usually is measured at 120 (100) Hz and 100 kHz.
C 3.2.4 Measurements / tests
Under this heading we will briefly survey the most common measurement conditions and tests for different parameters.
Capacitance and Dissipation factor
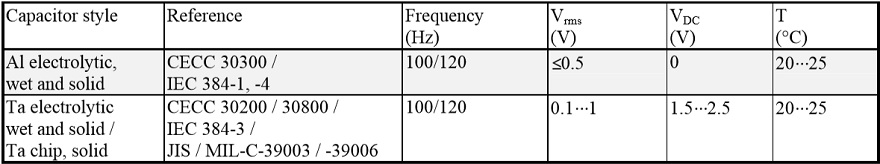
Table C3-1. Differences between different standard limits are held within stated limits in the table.
Leakage current / DCL
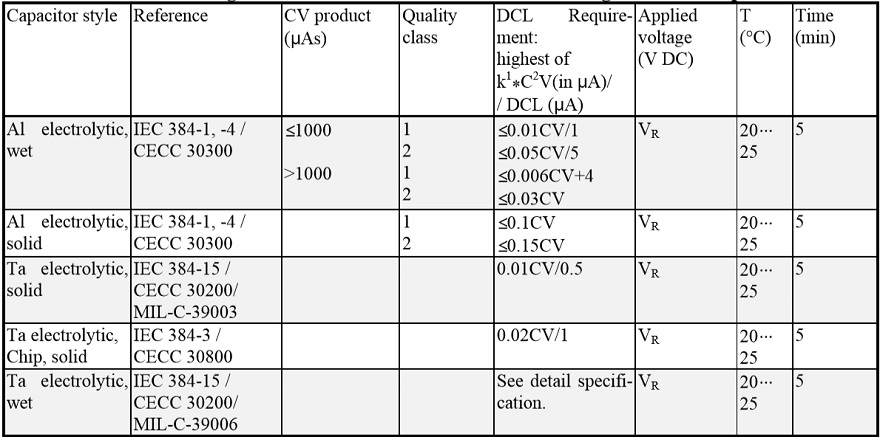
Table C3-2. DC Leakage measurements. In certain cases a limiting resistor Rs is prescribed.
Surge voltage tests
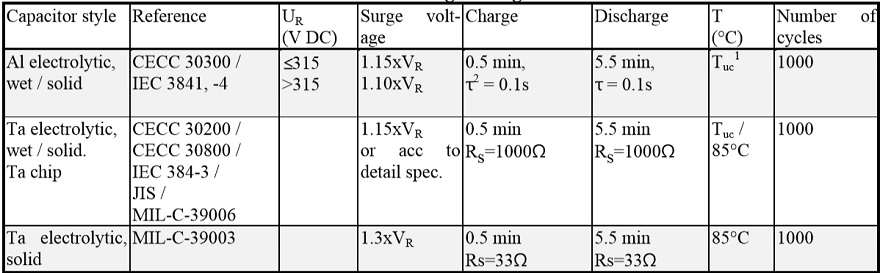
Table C3-3. Common surge voltage tests.
Reverse voltage tests
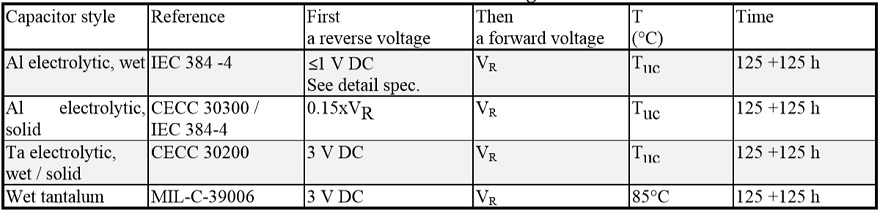
Table C3-4. Common reverse voltage tests.